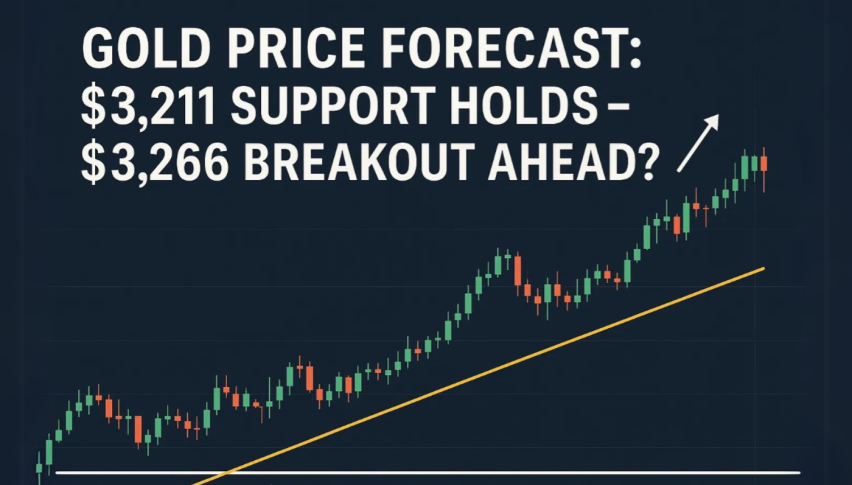
Gold Price Forecast: $3,211 Support Holds—$3,266 Breakout Ahead?
Gold (XAU/USD) is trading at $3,214 after bouncing off the weekly low of $3,095. The rally took out the descending channel...
Quick overview
- Gold (XAU/USD) is currently trading at $3,214 after a bounce from a weekly low of $3,095, breaking through a descending channel and the 50-hour EMA.
- Despite the technical breakout, momentum is waning near the $3,220 resistance zone, with signs of indecision among traders.
- The US dollar's strength and easing US-China trade tensions are contributing to gold's biggest weekly decline in six months.
- Key levels to watch include resistance at $3,220 and support at $3,211, with potential for further upside or bearish reversal depending on price movement.
Gold (XAU/USD) is trading at $3,214 after bouncing off the weekly low of $3,095. The rally took out the descending channel and the 50-hour EMA at $3,211. Despite this technical breakout, momentum is fading just below the $3,220 resistance zone. A cluster of spinning top candles is showing indecision among traders. This level was previously support and is now resistance and a potential double top.
The MACD is indicating early bearish pressure. The recent crossover above the zero line is weakening and the histogram is contracting – a warning sign for bulls. If price fails to hold above $3,211 it could drop to $3,172 or even $3,128. But a move above $3,220 could trigger a run to $3,266 and possibly $3,300.
Macro Forces Impacting Gold
Gold is set for its biggest weekly decline in six months as the US dollar strengthened and trade war fears eased. The dollar index (DXY) is up 0.4% for the week and is on track for its fourth straight weekly gain, making gold more expensive for international buyers.
US-China tensions cooled this week as both countries agreed to roll back tariffs, reducing global uncertainty and demand for safe-haven assets. US data showed producer prices fell and retail sales growth slowed. Consumer inflation also missed estimates in April.
Fed Governor Michael Barr said the economy is on solid ground and inflation is trending towards 2% but trade policy is a wild card. Markets are pricing in 57 basis points of rate cuts in 2025, starting as early as September. Lower rates are bullish for non-yielding assets like gold.
Supportive Dips and Key Levels
Gold is still attracting dip buyers so underlying support is present.

Key Levels:
-
Resistance: $3,220, $3,266, $3,300
-
Support: $3,211 (EMA), $3,172, $3,128
Watch for:
-
Breakout above $3,220 for more upside
-
Breakdown below $3,211 to confirm bearish reversal
-
MACD and candle confirmation at key levels.
-
Macro is bearish but technical is a toss up. Above $3,220 and it’s bulls. Below $3,211 and it’s bears.
- Check out our free forex signals
- Follow the top economic events on FX Leaders economic calendar
- Trade better, discover more Forex Trading Strategies
- Open a FREE Trading Account