Afrimat’s Stock Slides Below Key Support Despite CEO Optimism on Debt Recovery
Afrimat Limited (JSE: AFT) is trading at R49.98, down 2.5% for the week and falling further after breaking the R50.12 support level.
Quick overview
- Afrimat Limited's stock is trading at R49.98, down 2.5% for the week after breaking the R50.12 support level.
- The company reported a 58.5% decline in operating profit for the year to February 2025, despite a 36.7% increase in revenue due to the Lafarge acquisition.
- CEO Andries van Heerden is optimistic about future cash flow recovery and debt reduction, citing profitable Lafarge units as a positive factor.
- Technical analysis indicates a bearish trend for Afrimat shares, with key support levels at R49.87, R48.76, and R47.59.
Afrimat Limited (JSE: AFT) is trading at R49.98, down 2.5% for the week and falling further after breaking the R50.12 support level. The R7.9 billion company reported a 58.5% decline in operating profit for the year to February 2025, down from R1.15 billion to R477.7 million. Revenue increased 36.7% to R8.3 billion (Lafarge acquisition) but net margins shrunk to 5.7%.
Cash flow from operations also dropped to R571.6 million from R1.55 billion. Headline earnings per share fell from 567.3 cents to 72.3 cents and the net debt-to-equity ratio ballooned to 48.9% from 1.4%.
Lafarge Integration Key to Future Margins
CEO Andries van Heerden is optimistic. He says Lafarge’s aggregates and fly ash units are already profitable, cement is near break-even and Afrimat expects cash flows to recover and get back to historically low debt levels in 2-3 years. The construction materials division had a 40.2% profit increase to R383.5 million, a positive that could support the debt reduction plan.
External factors could be positive. A stable rand, the South African budget vote and President Ramaphosa’s meeting with US President Donald Trump could lift market sentiment and investor confidence.
Afrimat Ltd (JSE: AFT) Technical Analysis – Bearish Breakdown
Afrimat shares are at R49.98, down 1.46% today and confirmed the breakdown below the R50.12 horizontal support level. On the 2-hour chart, price is firmly in a descending trendline and lower highs are dictating the broader bearish structure. The 50-EMA at R52.42 is rejecting any bullish attempts and acting as dynamic resistance.
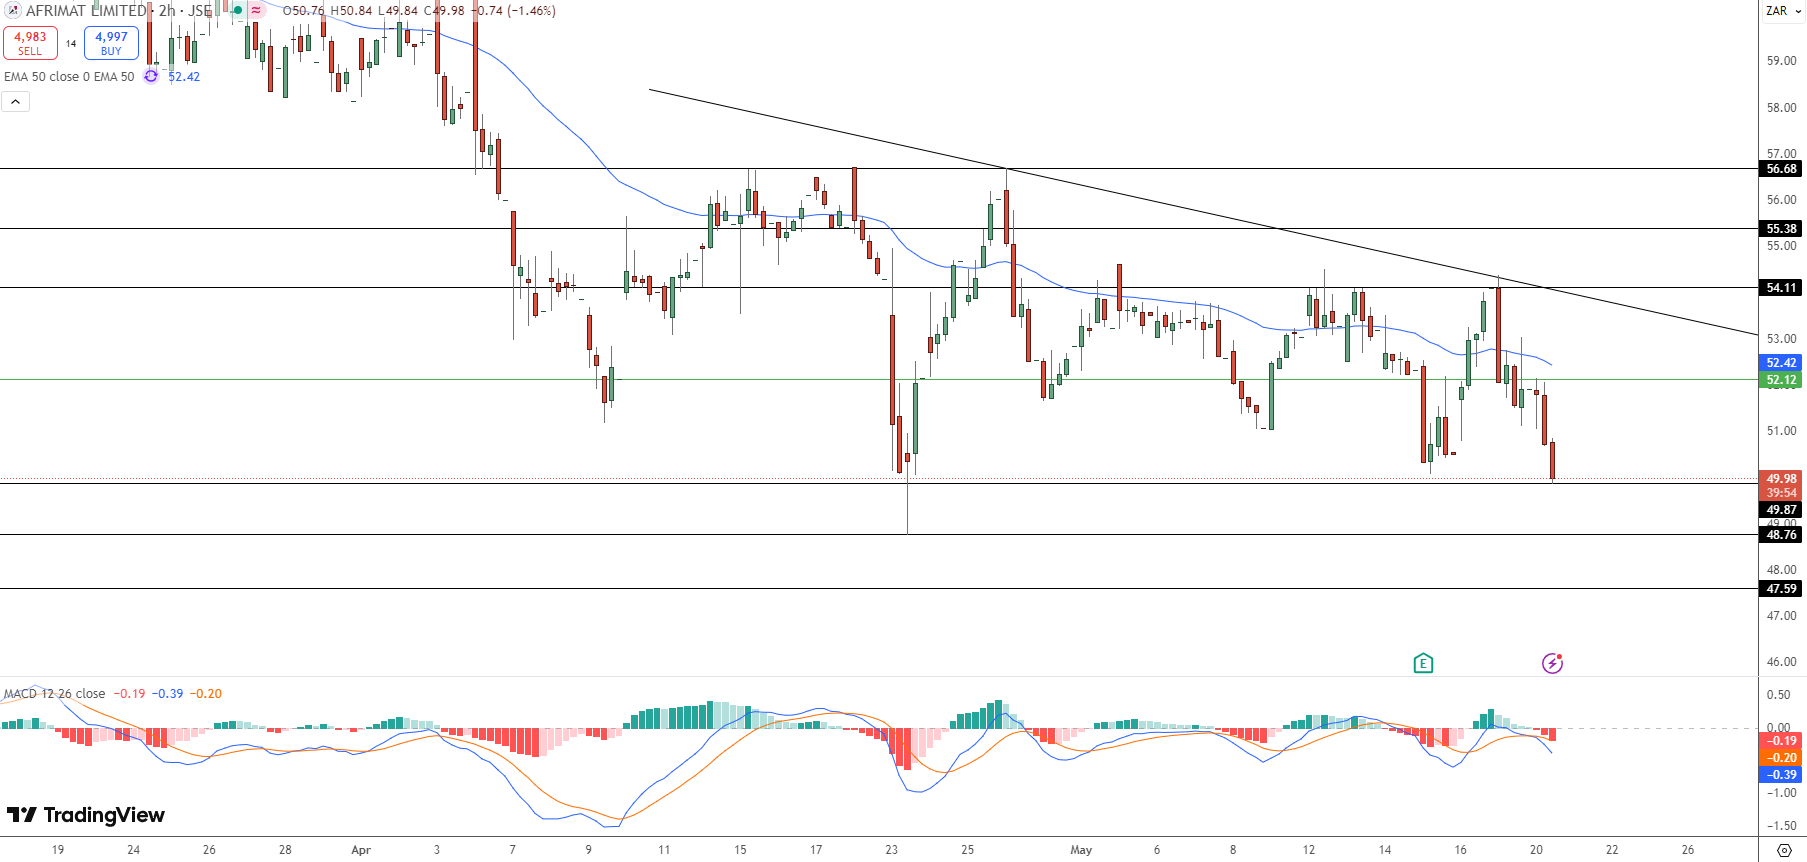
Candlestick action shows a series of rejections at the R52.00-R53.00 zone and today’s long red candle after a narrow-bodied indecision bar (spinning top) means bearish control is back. The MACD is rolling over again below the zero line, momentum is weakening. If Afrimat can’t hold the R49.87 minor support, the next levels down are R48.76 and R47.59.
For newbies: think of support levels like a floor—when the floor cracks, prices can fall to the next level down. And that trendline above? It’s a ceiling. Until Afrimat breaks above R52.50 with conviction, it’s stuck below that ceiling. Volume confirmation on the breakdown is key—watch for increasing red bars and a MACD cross to get ahead of the move.
- Check out our free forex signals
- Follow the top economic events on FX Leaders economic calendar
- Trade better, discover more Forex Trading Strategies
- Open a FREE Trading Account