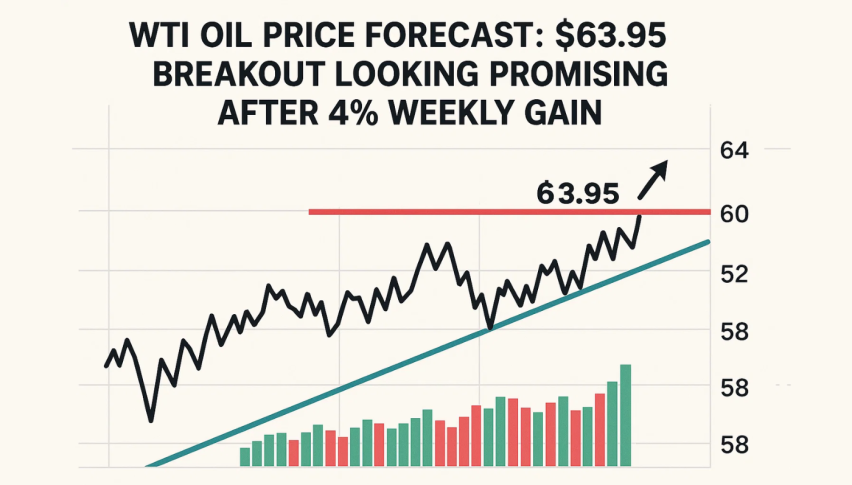
WTI Oil Price Forecast: $63.95 Breakout Looking Promising After 4% Weekly Gain
Oil's making a comeback! WTI crude is hovering around $63.15 on Friday, set to close out the week with a solid 4% gain...
Quick overview
- WTI crude oil is experiencing a rebound, closing the week at $63.15 with a 4% gain, marking its first weekly rise in three weeks.
- Canadian wildfires temporarily disrupted 7% of oil production, while mixed signals from Saudi Arabia regarding OPEC+ production have added to market volatility.
- Technical indicators suggest bullish momentum, with key support at $63.08 and resistance at $63.95, which traders are closely monitoring.
- A confirmed close above $63.95 could signal a stronger upward trend, while a drop below $63.00 may shift the short-term outlook negatively.
Oil’s making a comeback! WTI crude is hovering around $63.15 on Friday, set to close out the week with a solid 4% gain – its first weekly rise in three weeks. The summer driving season seems to be giving crude the boost it needed, with seasonal demand optimism finally outweighing those persistent oversupply worries.
What’s Driving Oil’s Rebound?
It hasn’t been a straight path up. The week had its share of drama that helped fuel early gains.
Those Canadian wildfires briefly knocked out about 7% of the country’s oil production, giving prices a temporary jolt. Luckily for residents (though perhaps not for oil bulls), cooler weather and rain helped get those fires under control.
Saudi Arabia sent mixed signals this week too. On one hand, they proposed an OPEC+ production increase of at least 411,000 barrels per day starting in August, with hints of more increases coming in September. But then they turned around and slashed their July selling prices for Asian buyers to nearly four-year lows – a pretty clear sign that demand in that key region might be weakening.
Meanwhile, everyone’s keeping an eye on those ongoing US-China trade discussions, which could turn global oil consumption patterns depending on how they play out.
Technical Picture: Bulls Building Momentum
From a chart perspective, things are looking increasingly constructive for oil. WTI has been respecting an upward trendline that’s been in place since late May, with investors consistently showing up when prices drop toward the $63.00-$63.10 zone.
The 50-period EMA on the hourly chart (currently at $63.08) aligns perfectly with this trendline, creating a solid support level that bulls seem determined to defend.
Key Levels to Watch:
Support Zones:
- $63.08 (trendline and 50-period EMA)
- $62.17
- $61.52
Resistance Levels:
- $63.95 (immediate hurdle)
- $64.66
- $65.36
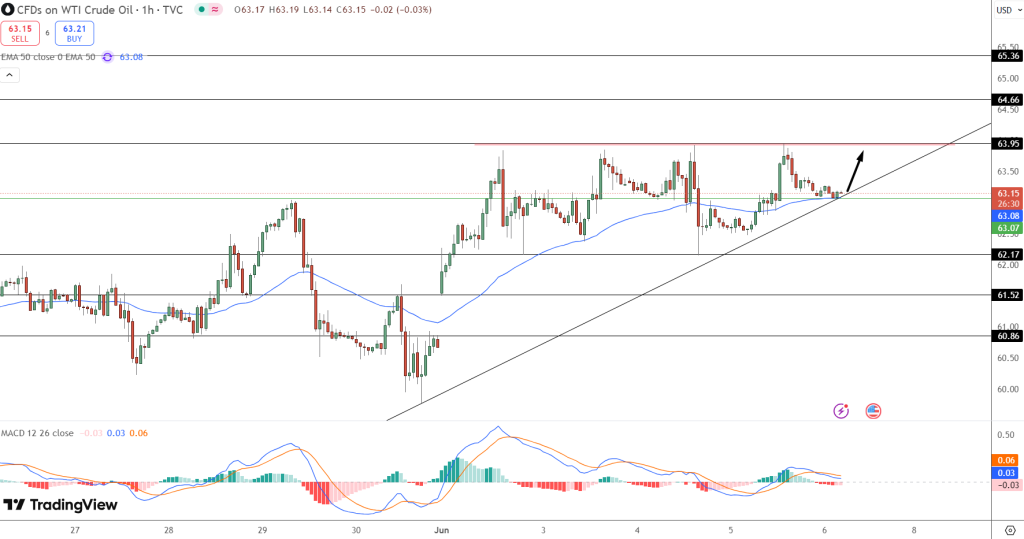
The MACD indicator is hovering near the zero line with flattening signal lines – typical consolidation behavior before the next move. If we get a bullish crossover from here, it could be the catalyst that sends crude toward that $63.95 resistance level.
How to Play This Setup
If you’re bullish: Wait for a confirmed close above $63.95. That’s your signal that momentum is strong enough to push prices toward $64.66 and potentially beyond. Just make sure to place a stop-loss below $63.00 to protect yourself if the breakout fails.
If you’re cautious: Keep a close eye on that rising trendline around $63.00. If prices break below it convincingly, the short-term outlook shifts, and we could see a move down to test $62.17 or even $61.52.
The Bottom Line
Oil sits at an interesting junction right now, with both technical and fundamental forces starting to align in a more positive direction. The rising trendline and consistent buying at dips suggest underlying strength, while the seasonal boost from summer travel provides fundamental support.
A decisive close above $63.95 would be the confirmation many traders are waiting for. Until then, this consolidation phase continues – but with an increasingly bullish tilt. Watch those levels closely, because the next breakout might be just around the corner.
- Check out our free forex signals
- Follow the top economic events on FX Leaders economic calendar
- Trade better, discover more Forex Trading Strategies
- Open a FREE Trading Account