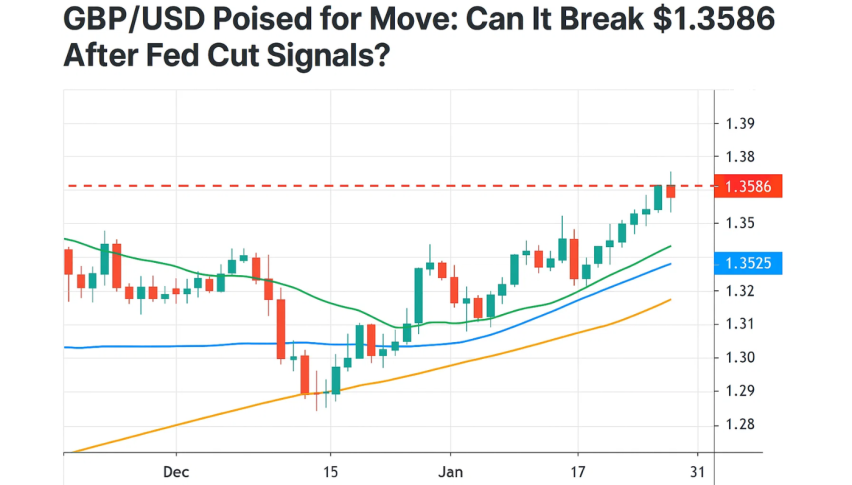
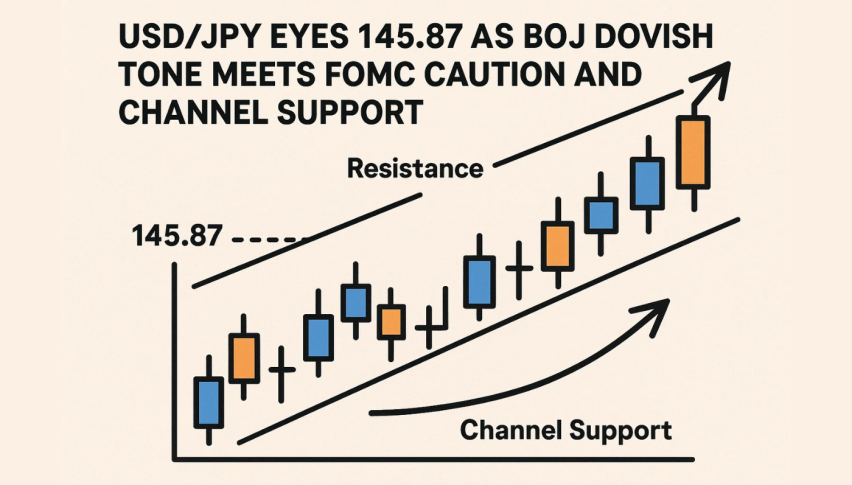
USD/JPY Eyes 145.87 as BoJ Dovish Tone Meets FOMC Caution and Channel Support
European session: USD/JPY is trading near 144.85, down slightly as safe-haven demand is supporting the Japanese Yen.
Quick overview
- USD/JPY is trading near 144.85, supported by safe-haven demand for the Yen but limited by the BoJ's dovish stance and weak domestic data.
- The BoJ maintained rates at -0.5% and plans to taper bond purchases, pushing back rate hike expectations to 2026 amid fragile macro conditions.
- In the US, disappointing economic data has led to rate cut expectations, but safe-haven flows into the Dollar due to Middle East tensions are providing some support.
- Technically, USD/JPY remains in an uptrend with key support at 144.62, and a bullish outlook unless it breaks below 144.12.
European session: USD/JPY is trading near 144.85, down slightly as safe-haven demand is supporting the Japanese Yen. But that’s capped by the BoJ’s dovish tone and weak domestic data. The BoJ kept rates steady at -0.5% and will taper bond purchases from April next year, no rush to unwind.
This has pushed back rate hike expectations to 2026, according to a Reuters poll. Japan’s macro is still fragile. Machinery orders fell 9.1% in April, the biggest decline since April 2020, and June’s Tankan survey showed declining sentiment among manufacturers. This reinforces the BoJ’s caution and is softening the Yen even as the broader market is risk-off.
FOMC in Focus as US Data Disappoints
Across the pond, the US Dollar is facing headwinds after weak data. May retail sales fell 0.9% and industrial production contracted 0.2%, feeding rate cut expectations later this year. But the Middle East conflict is sparking some flows into the Dollar as a safe-haven, tempering the downside.
All eyes are now on the FOMC’s 2-day meeting. If Powell is dovish, USD/JPY could go lower. If he’s hawkish, Dollar bulls will be reenergized.
Technical Setup Points to Rebound
USD/JPY is in an uptrend on the 2-hour chart. The pair just tested the support at 144.62 (channel base and 50-period EMA) which has been a bounce level multiple times. Price has pulled back from 145.43 but the structure is still bullish unless 144.12 breaks.
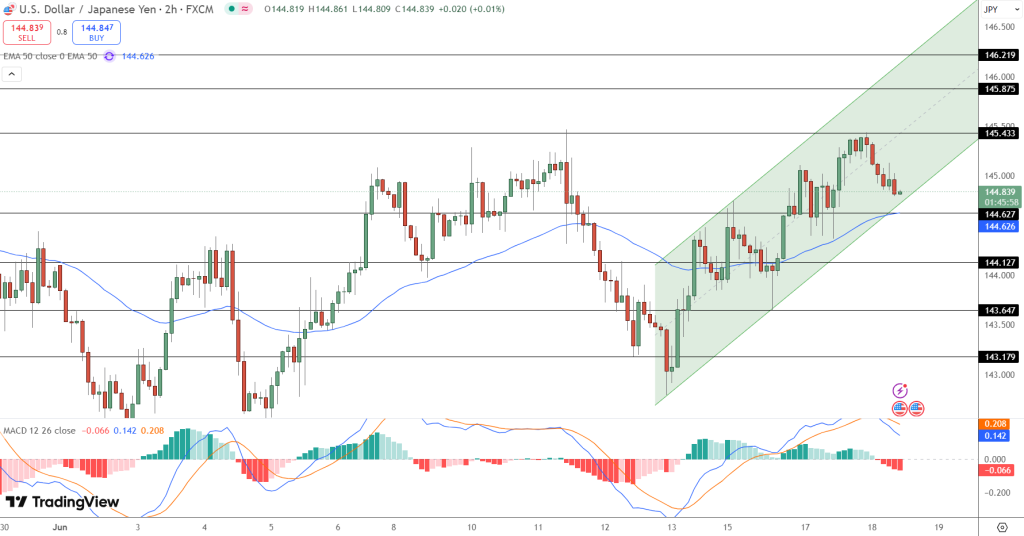
MACD is flattening. Contracting histogram bars and narrowing signal lines mean sellers are losing steam. Candlestick formations near the channel base show consolidation, not bearish conviction—a sign that dip-buyers may step in.
Trade Setup:
- Entry: 144.85
- Stop-Loss: 144.12
- Target 1: 145.43
- Target 2: 145.87
Higher low in a channel. Bullish close above 144.85 or MACD crossover. Below 144.12 and we’re out.
- Check out our free forex signals
- Follow the top economic events on FX Leaders economic calendar
- Trade better, discover more Forex Trading Strategies
- Open a FREE Trading Account