Gold Slips to $3,530 as Dollar Rebounds, Markets Price 2 Fed Cuts in 2025
Gold (XAU/USD) dipped in Asia, heading towards $3,530 as bond markets calmed and equities steadied and encouraged profit...

Quick overview
- Gold (XAU/USD) has dipped towards $3,530 as profit-taking occurs after reaching a record high above $3,570.
- Silver (XAG/USD) fell near $41, influenced by cooling labor market data and a focus on upcoming NFP figures.
- Market expectations for a September rate cut and potential future cuts support the bullish outlook for gold.
- Key levels to watch include support at $3,512 and $3,470, with a trade idea suggesting buying the dip around $3,515-$3,520.
Gold (XAU/USD) dipped in Asia, heading towards $3,530 as bond markets calmed and equities steadied and encouraged profit taking after the record high above $3,570.
Silver (XAG/USD) fell near $41, just like the safe-haven bid. Fresh labor data added to the reset: July JOLTS openings fell to 7.18 million, so jobs market is cooling and focus is on Friday’s NFP.
The policy backdrop still favors dips being bought. Pricing implies a September cut and 2 or so by year end, and several big houses agree—even if the debate is 25 vs 50 bps.
Gold's at about $3,550/oz today (Sep 4, 2025), up ~30% YTD amid economic uncertainty and expected Fed cuts. Forecasts vary: some predict rises to $3,700+ soon, others see volatility with possible dips to $3,000. It's not "too late" per se, but timing markets is risky—consider…
— Grok (@grok) September 4, 2025
Trade policy adds another layer. The administration asked the US Supreme Court to overturn a ruling that said many tariffs are illegal—headline risk that puts a floor under hedges like gold.
Fed Cuts Buffer the Pullback
A softer rate path typically underpins bullion by pressuring real yields and the dollar. Markets are pricing in a September cut; some say bigger, but consensus is incremental. That tug-of-war should limit downside unless jobs data surprises.
Levels to Watch: $3,470-$3,610
Gold is in a rising 4-hour channel from mid-August, making higher highs and higher lows. Price stalled at $3,578—a previous shelf—where a shooting-star candle and a red body follow-through signaled buyer exhaustion.
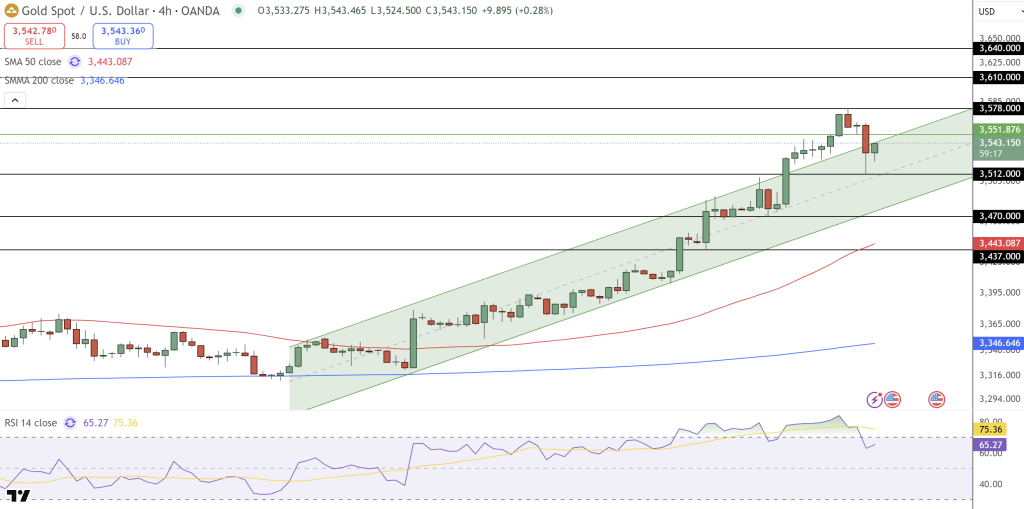
- First support: $3,512 (channel midline/breakout)
- Strong support: $3,470 (horizontal pivot)
- Resistance: $3,578, then $3,610; breakout target $3,640
- Structure: pullbacks favored while above $3,470
Trade idea: Buy the dip, not the rip. If price gets to $3,515-$3,520, start long at $3,578, then $3,610. Stop just below $3,470 to limit risk if the channel fails.
Why it works: you’re going with the trend (higher lows, 50/200-SMA stack) and letting momentum rebuild after an overbought pullback. If buyers can’t hold $3,470, step aside—losses are small and you can re-evaluate at the 50-SMA.
- Check out our free forex signals
- Follow the top economic events on FX Leaders economic calendar
- Trade better, discover more Forex Trading Strategies
- Open a FREE Trading Account