Aussie Pumped up by a Greater than Expected Trade Balance


Today wasn’t the most active day in the FX market. Nevertheless, there were some decent moves here and there.
The British Pound lost a lot of ground as the BOE (Bank of England) left UK policy measures unchanged today. The UK also seems less likely to overshoot their inflation targets, which would have necessitated the tightening of monetary policy by the BOE. This tightening would have included interest rate hikes, which normally has the effect of attracting capital flows to a currency. As you know, money follows yield.
Before we look at the GBP/USD, let’s look at the AUD/USD first. The Australian Dollar performed really well today on the back of a better than expected trade surplus number. Let’s look at a few charts:
AUD/USD – Ripping Higher
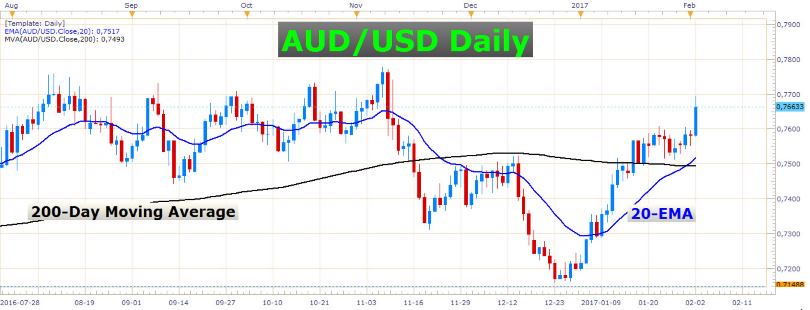 AUD/USD Daily Chart
While most of the major pairs produced limited movement today, the AUD/USD posted an above-average bullish daily candle.
As you can see in the chart above, the pair consolidated for a few days before breaking out with a bang. In the process, the pair also printed a fresh 2017 high today.
The AUD/USD is fast approaching an important resistance zone. It will be interesting to see how the pair reacts to this zone, and whether it will finally break out of the wide 9-month range in which it has been fooling around. Here is a chart that highlights this large range:
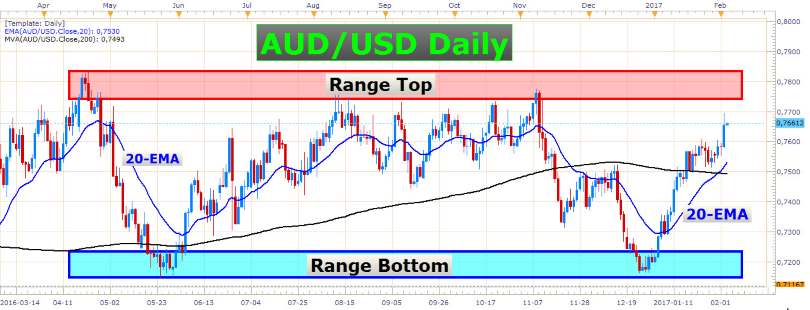 AUD/USD Daily Chart
If you’re thinking of trading the AUD/USD, you might want to wait a bit before entering long. Notice how the price has extended really far from the 20-day exponential moving average. It is normally much more ideal to enter on retracements in order to ‘buy low’ and then ‘sell high’. Besides this, when an instrument has extended really far from its mean value, the chances of a retracement is much higher than it normally is. This can work to your disadvantage if you enter late and “chase” the price. Buying closer to, for example, the 20-EMA in a bull trend will improve your results in the long run.
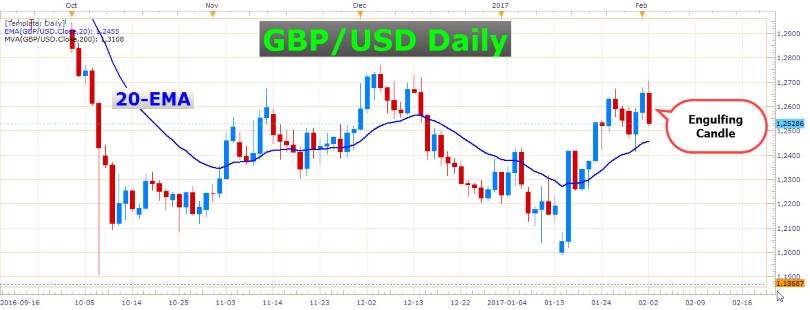
GBP/USD – Engulfing Daily Bar!
 GBP/USD Daily Chart
As you can see, today’s candle closed below the low of the prior candle. Its high is also higher than the prior candle’s high. This qualifies today’s candle as an engulfing candle, which can be a powerful price action signal when it comes to trading reversals.
A bearish engulfing candle like this often points to a continuation of the selling momentum in the days thereafter. Today’s large bearish candle could easily be the start of a new leg lower in this exchange rate.
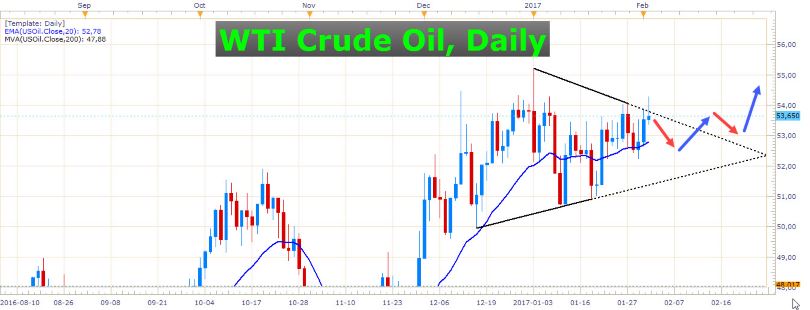
WTI Crude Oil – Failed Breakout
 WTI Crude Oil Daily Chart
Crude oil has been stuck in a wedge for quite a couple of days. The bulls managed to pierce this wedge today but were unable to follow through with their effort. The result is a rejection candle in the form of a failed breakout (also called a fakeout). This candle shows that the bulls got exhausted along the way. Also, we know by the shape and position if this candle, that there are a few bullish market players that are already caught up on the wrong side of the market, and a further decline in the oil price would put further pressure on them. When these traders start to close out their losing positions, it will add to the downward pressure on this instrument. I don’t think we’ll see a sudden trend reversal here, but I do think we’ll encounter a correction of some sort in the next few trading days.
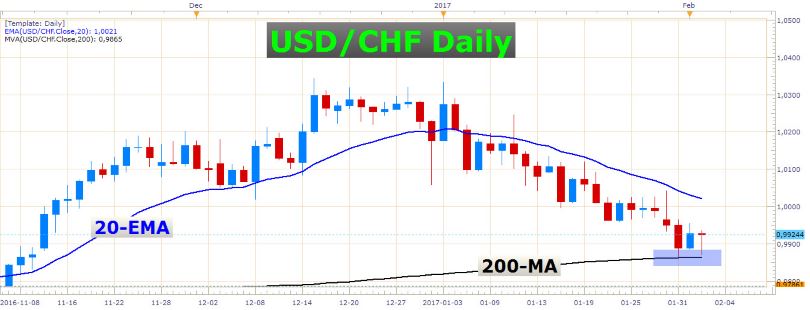
USD/CHF – Bouncing off a Key Level
 USD/CHF Daily Chart
The USD/CHF bounced off the 200-day moving average today for the second time this week. This makes me wonder if this could perhaps be a turning point for this pair. If you are looking to sell this pair, I would advise you to be careful here.
News
Tomorrow is NFP Friday. The Nonfarm Payrolls number is arguably the most anticipated U.S. economic news event. It is known to have caused massive market movements in the past. Be careful of excessive volatility here.
The U.S. unemployment rate and other labor market data will be released together with the NFP number at 13:30 GMT.
Besides these, we also have the UK services PMI number at 09:30 GMT.
That’s all for now, guys. Have a great day and best of luck with your trading!