Gold Signal In 70 Pips Profit – Gartley Pattern in Play!


Good morning, traders. You must be excited about the Gold's forex trading signal! As mentioned in Gold Finds Support, Is It a Good Time to Go Long?, we spotted an upward trend and went long on Gold at $1325. Now it's floating in 70 pips profit. Exciting, isn't it?! Let's see how we can manage this trade.
Key Technical Drivers
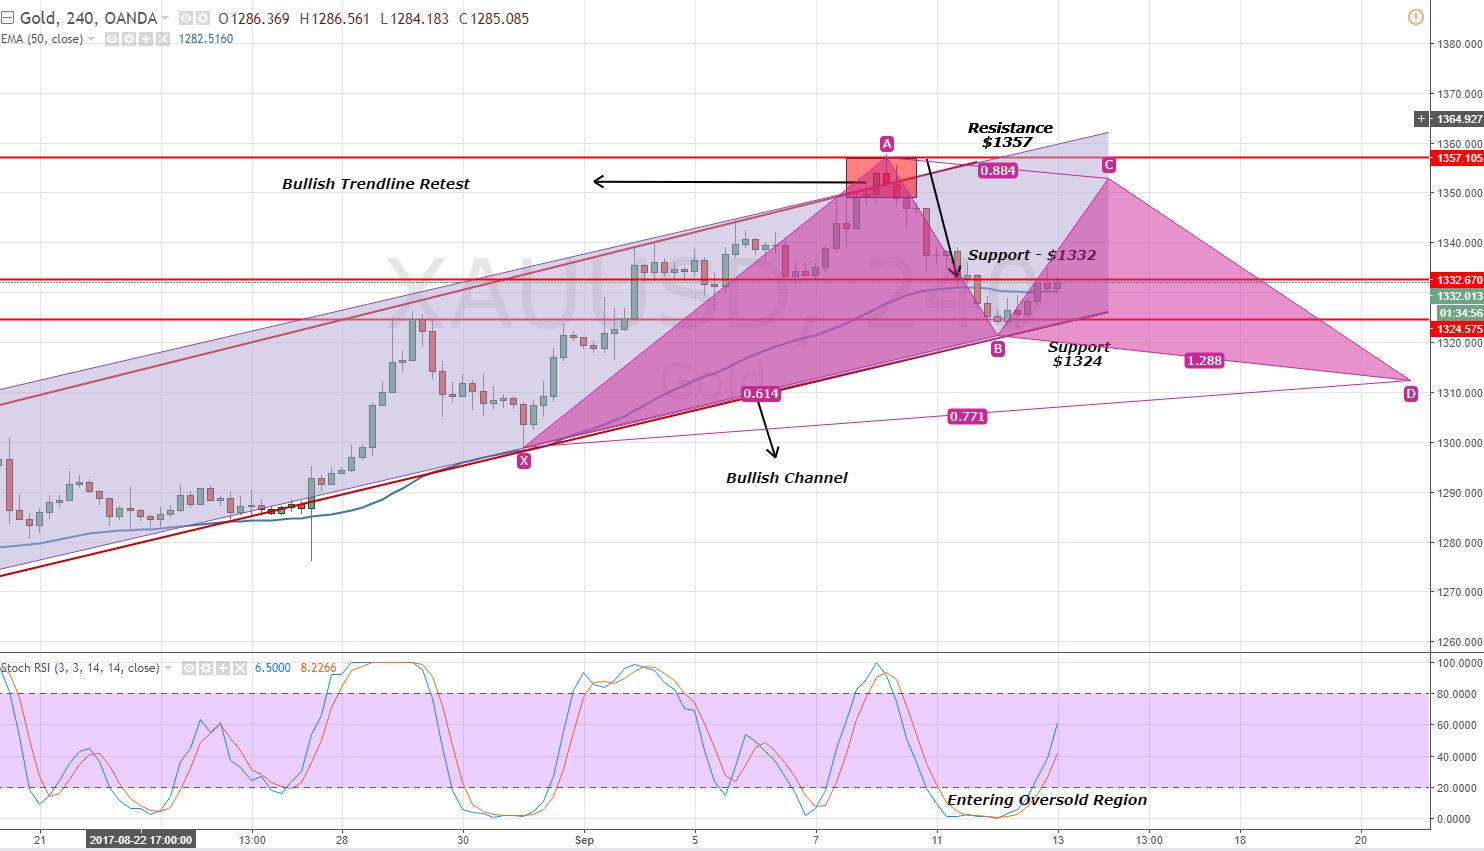
In my previous update, we discussed the bullish Gartley pattern. The Gold was expected to complete 61.8% Fibonacci retracement at $1321, the B point of Gartly before making a bullish move. That's exactly how it traded.
 Gold – 4 Hour Chart – Gartley Pattern
 Gold – 4 Hour Chart – Gartley Pattern
 For now, the Gold is heading north to target $1350, but there are several points where Gold can find resistance. For instance, the immediate resistance is at $1332, and the break above will lead it towards $1341. The Gold has completed 61.8% retracement at point B and now it has a potential to go for point C at $1352.
Besides that, the same bullish channel and leading indicators are supporting the bullish bias. Particularly, the Stochastic & RSI has come out of the oversold region and heading towards bullish crossover at 50.
Gold – Trading Idea
As we are already trading at $1325, trailing the stop at breakeven ($1326) will be a good idea. As advised earlier, we can take partial profits at $1330, $1338 and $1343. We need to follow the FX Leaders Risk Management Strategies to limit our risk and maximize the profitability. Good luck and keep following for more exciting trading signals.