Let’s Hope This Is It For EUR/USD Bulls at the 20 Weekly SMA
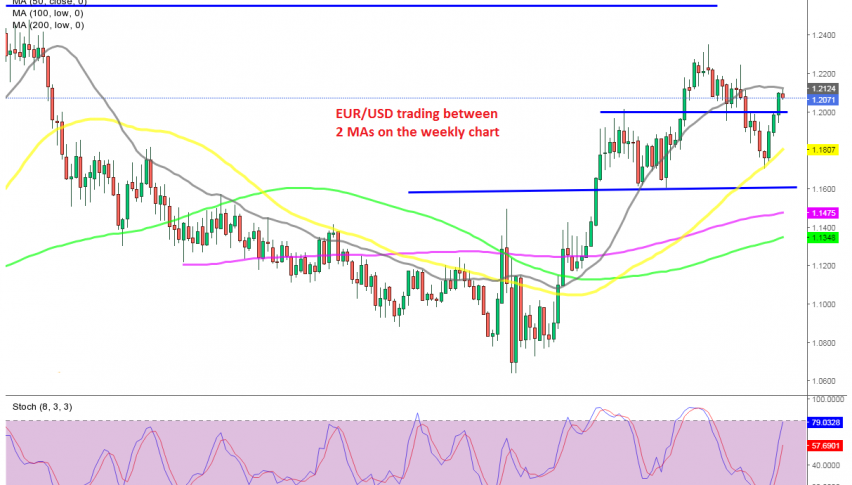
EUR/USD has retreated 50 pips from the 20 SMA on the weekly chart
[[EUR/USD-sponsored]]
EUR/USD turned really bullish since March last year, as the USD went through a period of immense weakness, despite the economy being in the best shape compared to other major economies around the globe. As a result, this pair increased around 15 cents to 1.2350s.
But, the climb came to an end in the first week of January, and after an upside-down hammer candlestick which is a bearish reversing signal after the climb, this pair lost 6 and a half cents. Although, the retreat ended at the 50 SMA (yellow) on the weekly chart.
The USD turned weak again this month and EUR/USD bounced off the 50 SMA, moving more than 400 pips higher. EUR/USD moved above 1.20 last week and above 1.21 today, although it seems like the bounce might be over now.
The price reached the 20 SMA (gray) a while ago and has retreated 50 pips lower now. It’s a bit too early to tell, but this is a good sign and we hope the reversal down begins now, since we are already short on this pair from just below 1.20.
- Check out our free forex signals
- Follow the top economic events on FX Leaders economic calendar
- Trade better, discover more Forex Trading Strategies
- Open a FREE Trading Account
- Read our latest reviews on: Avatrade, Exness, HFM and XM
Related Articles


Sidebar rates
Related Posts
