Bitcoin Slips Under $20,500 – Quick Daily Outlook
Bitcoin is currently trading below the $21,000 mark against the US dollar. Until there is a clear move just above the $20,750 resistance
Bitcoin is currently trading below the $21,000 mark against the US dollar. Until there is a clear move just above the $20,750 resistance zone, BTC could continue to fall. BITCOIN has begun to decline below the $21,000 and $20,500 support levels.
The price is currently trading below the $20,500 level and the 100 hourly simple moving average. On the hourly chart of the BTC/USD pair, a major bearish trend line is forming with resistance near $20,820. If there is an evident move below $20,000, the pair could fall even further.
Bitcoin’s Value is Declining
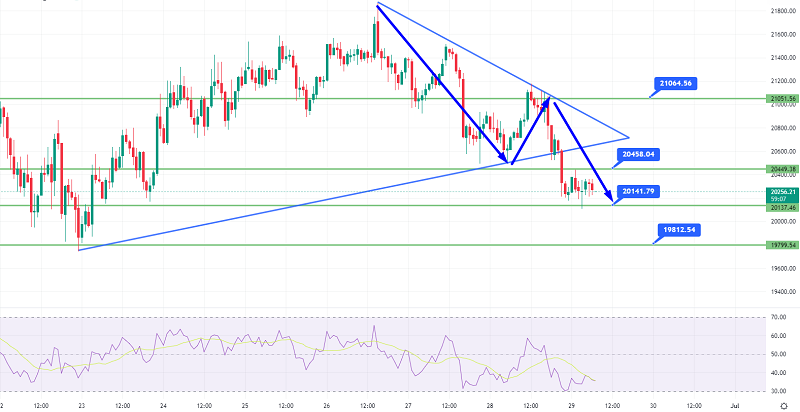
Bitcoin price remained bearish below the pivot level of $21,000. The bulls could not push the price higher, and a bearish reaction occurred below the $20,800 level. The price was trading below the 61.8 percent Fib retracement level of the crucial recovery from the swing low of $19,750 to the high of $21,780. The price fell so far that the bears pushed it below the $20,550 and $20,500 support levels.
It tested the key recovery’s 76.4 percent Fib retracement level from the swing low of $19,750 to the high of $21,780. Bitcoin is trading below $20,500 and the 100 hourly simple moving average.
On the upside, immediate resistance is near the $20,520 level. The next significant resistance level is around $20,750. On the hourly chart of the BTC/USD pair, a major bearish trend line is forming with resistance near $20,820.
A clear break above the trend line resistance, followed by a move above $21,000, could kickstart a decent increase. In the aforementioned scenario, the price could start rising above the $21,250 mark. The next big obstacle for the bulls could be near the $21,750 level, after which the price could increase to the $22,500 level.
More Bitcoin Losses?
If Bitcoin fails to break through the $21,000 resistance level, it may continue to fall. On the downside, there is immediate support near the $20,220 level.
A break underneath the $20,220 support level could lower the price. The next significant support is located near the $20,000 level. Any further losses could push the price down to $18,800 or a new monthly low.
- Check out our free forex signals
- Follow the top economic events on FX Leaders economic calendar
- Trade better, discover more Forex Trading Strategies
- Open a FREE Trading Account
- Read our latest reviews on: Avatrade, Exness, HFM and XM
Related Articles


Sidebar rates
Related Posts
