Selling Crude Oil, As it Gets Rejected at MAs


Crude Oil is showing bearish signs again after making a bullish move in the last several days. Oil has been on a larger bullish trend for more than two years, since US WTI fell to -$37.50 during the initial breakout of the coronavirus. Although, earlier this month we saw a crash that sent crude Oil more than $20 lower toward $100 on fears of a global recession.
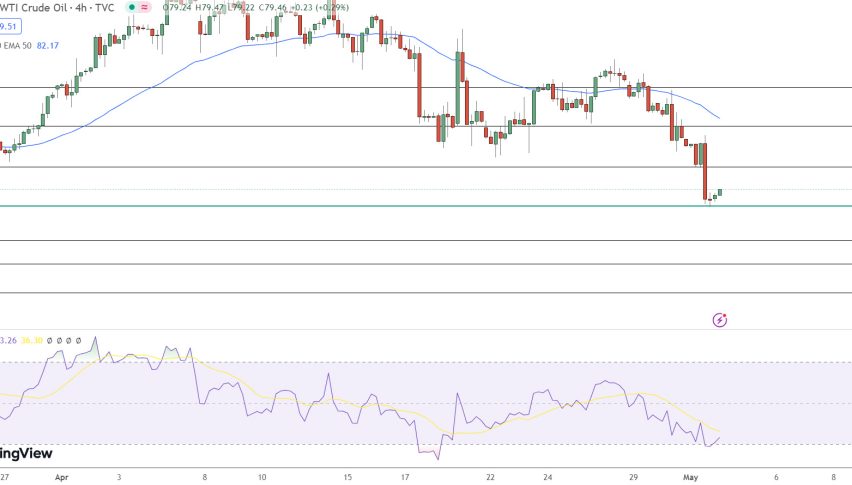
In the last several days we have seen a bullish move which sent the price to $114 today, but the 200 SMA (purple) and the 100 SMA (green) rejected the price on the H4 chart and now Oil is more than $2 lower. So, moving averages are turning into resistance for Oil now, which is a bearish signal.
Crude Oil H4 Chart – MAs Turning Into Resistance for Crude Oil

Crude Oil being rejected swiftly
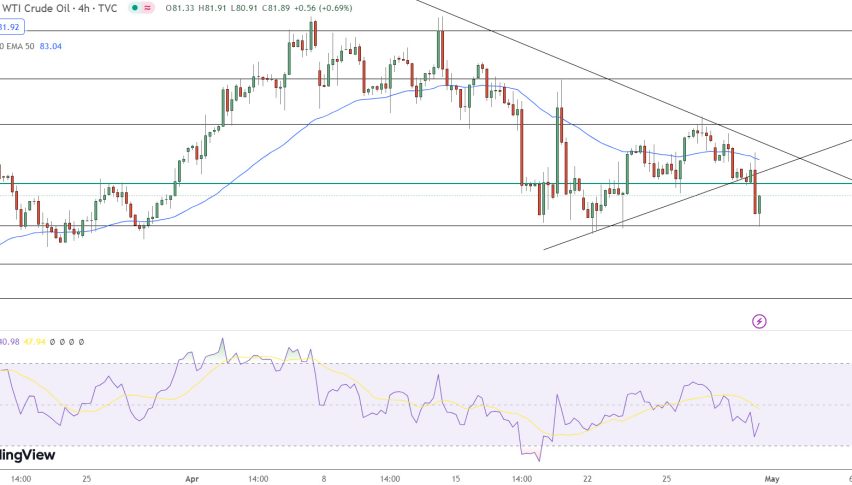
On the smaller timeframe charts, we are also seeing a swift reversal and moving averages are turning into resistance here as well. We see that Oil has lost around $2.50 in less than 2 hours. We were waiting for a retrace higher which we got a while ago and decided to open a sell Oil signal after the rejection at the 20 SMA (gray) on the 3-minute chart, booking profit as the price reversed down.
Crude Oil 3 Minute Chart – The 20 SMA Rejects Oil Too

The decline has been pretty steep so far
Oil was falling before some comments crossed from US envoy Hochstein but this added to it:
- A welcomed major change in attitude from OPEC+
- Hopes OPEC+ will move to Step 2 of the supply boost
- Hopes OPEC continues putting on more supply
- Says US can assess more SPR releases after October
This cryptic ‘step 2’ comment suggests the US has pushed a plan for further supplies on the Saudis. You start to wonder if they have MBS in their back pocket. The comment about further SPR releases is interesting as well, though the reserve is already at the lowest since 1986. At some point, the need to refill it will put upward pressure on the back end of the curve.