Nikkei Forming A Bullish Reversal Setup At the 100 SMA
Nikkei has retraced lower for months, but it has formed a bullish reversing pattern on the weekly chart
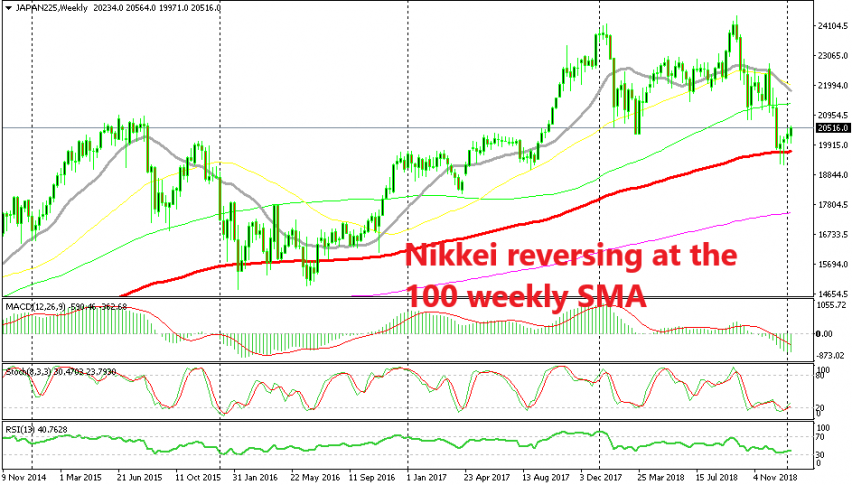
Stock markets went through a big decline in the last few months of last year as the sentiment turned negative due to weakening growth of the global economy. Although, if we look at the bigger picture we see that the trend is still bullish and this was just a pullback of that trend, albeit a major one.But, in the last few weeks of 2018 stocks formed a bottom and started reversing higher. Nikkei lost considerable value during this time but it found support at the 100 SMA (red) on the weekly chart. This moving average has provided support again back in 2016, although not exactly to the pip. But, the zone surrounding the 100 SMA did provide support back then and reversed the trend to bullish again.
Now, we see that Nikkei is finding support again at the 100 SMA. It has been pierced a couple of times, but the weekly candlesticks closed above it. It formed two small hammers that are reversing signals, followed by two bullish candlesticks, albeit they are small as well.
The stochastic indicator is also oversold which means that Nikkei is oversold now, making this is the perfect bullish reversing chart setup. In normal times, I would go long on Nikkei, but the global economy continues to slow further and things are getting from bad to worse in the Eurozone and China. So, I will rather look to sell further up than go long from here.
- Check out our free forex signals
- Follow the top economic events on FX Leaders economic calendar
- Trade better, discover more Forex Trading Strategies
- Open a FREE Trading Account
- Read our latest reviews on: Avatrade, Exness, HFM and XM
Related Articles


Sidebar rates
Related Posts
