NZD to USD Rate Returns Inside the Range After the Fakeout
The USD to NZD rate has returned to consolidation mode within a range, following a spike above the range early last week.
The USD to NZD rate has returned to consolidation mode within a range, following a spike above the range early last week. The spike above the range hinted at a possible upward trend, but subsequent events led to a reversal. High Non-Farm Payrolls jobs statistics exerted downward pressure on the NZD/USD rate on Friday, causing it to retreat to the bottom of the range.
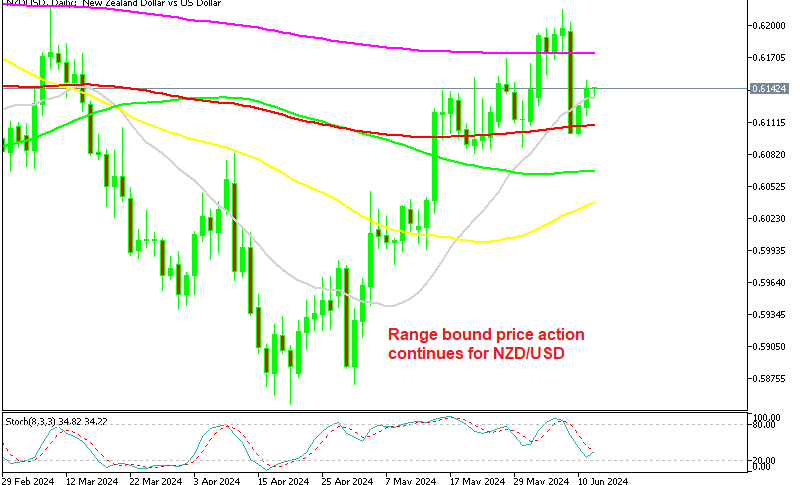
NZD/USD Chart Daily – The 100 SMA Has Turned Into Support Again
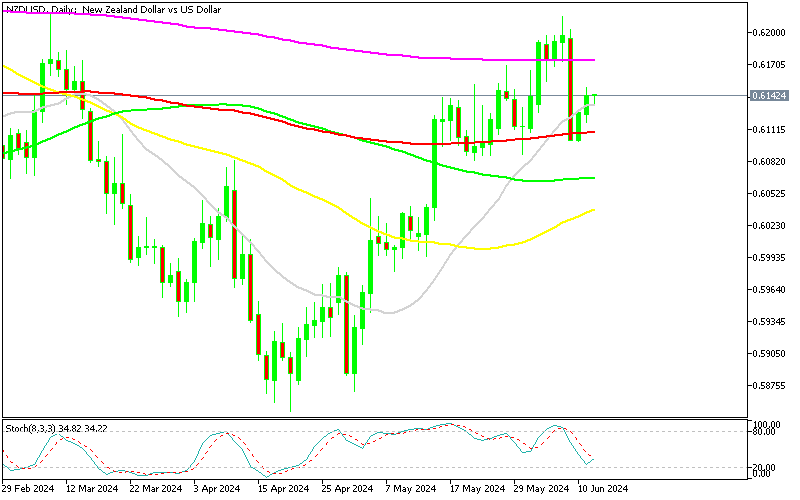
However the decline stopped and the price found support at the 100-day Simple Moving Average (SMA), denoted by the red line, indicating its significance as a support level. The breakout above the 200-day SMA followed some positive economic news from China and New Zealand. However, this breakout turned out to be a fakeout, as the market reversed back down, potentially triggering stop-loss orders placed above this moving average.
Now the NZD/USD rate remains within the range, indicating a lack of clear directional bias at the moment. We are closely following the price action whet it gets close to both the 100-day SMA (red0 and the 200-day SMA (purple) for potential trades at support and resistance levels, respectively.
Earlier today during the Asian session, we had the CPI (consumer price index) and the PPI (producer price index) from China, both of which were expected to show a slight increase. Inflation did increase in China, however it slightly missed the expectations.
China May CPI and PPI Figures
Consumer Price Index (CPI):
- May CPI YoY: +0.3% (vs expected +0.4%)
- April CPI YoY: +0.3%
The May CPI remained steady at 0.3% year-on-year, slightly below expectations of 0.4%. This indicates that consumer inflation is relatively stable but subdued, which suggests moderate demand in the economy.
Producer Price Index (PPI):
- May PPI MoM: +0.2%
- April PPI MoM: -0.6%
- May PPI YoY: -1.4% (vs expected -1.5%)
- April PPI YoY: -2.5%
The May PPI figures show a significant improvement:
- Month-on-Month (MoM): Increased by 0.2%.
- Year-on-Year (YoY): Deflation slowed to -1.4%, better than the expected -1.5% and a notable improvement from -2.5% in April.
NZD/USD Live Chart
- Check out our free forex signals
- Follow the top economic events on FX Leaders economic calendar
- Trade better, discover more Forex Trading Strategies
- Open a FREE Trading Account
- Read our latest reviews on: Avatrade, Exness, HFM and XM
Related Articles

Sidebar rates
Related Posts
