Boxer Retail Breakout Watch—Can It Smash 7,393?
Boxer Retail (JSE: BOX.JO) is approaching a make-or-break moment. After rebounding from a low of 6,005 in April, the share price surged...
Quick overview
- Boxer Retail's share price is at a critical juncture, nearing resistance at 7,098 after a rebound from a low of 6,005.
- Current support is at 6,870, with crucial levels at 6,865, 6,701, and 6,533, indicating potential downside risk if broken.
- Valuation metrics show mixed signals, with a P/E ratio of 25.50 and a high debt-to-equity ratio of 239.66%, raising concerns about balance sheet risk.
- Short-term traders should watch for a breakout above 7,100 for potential gains, while a drop below 6,865 could signal further declines.
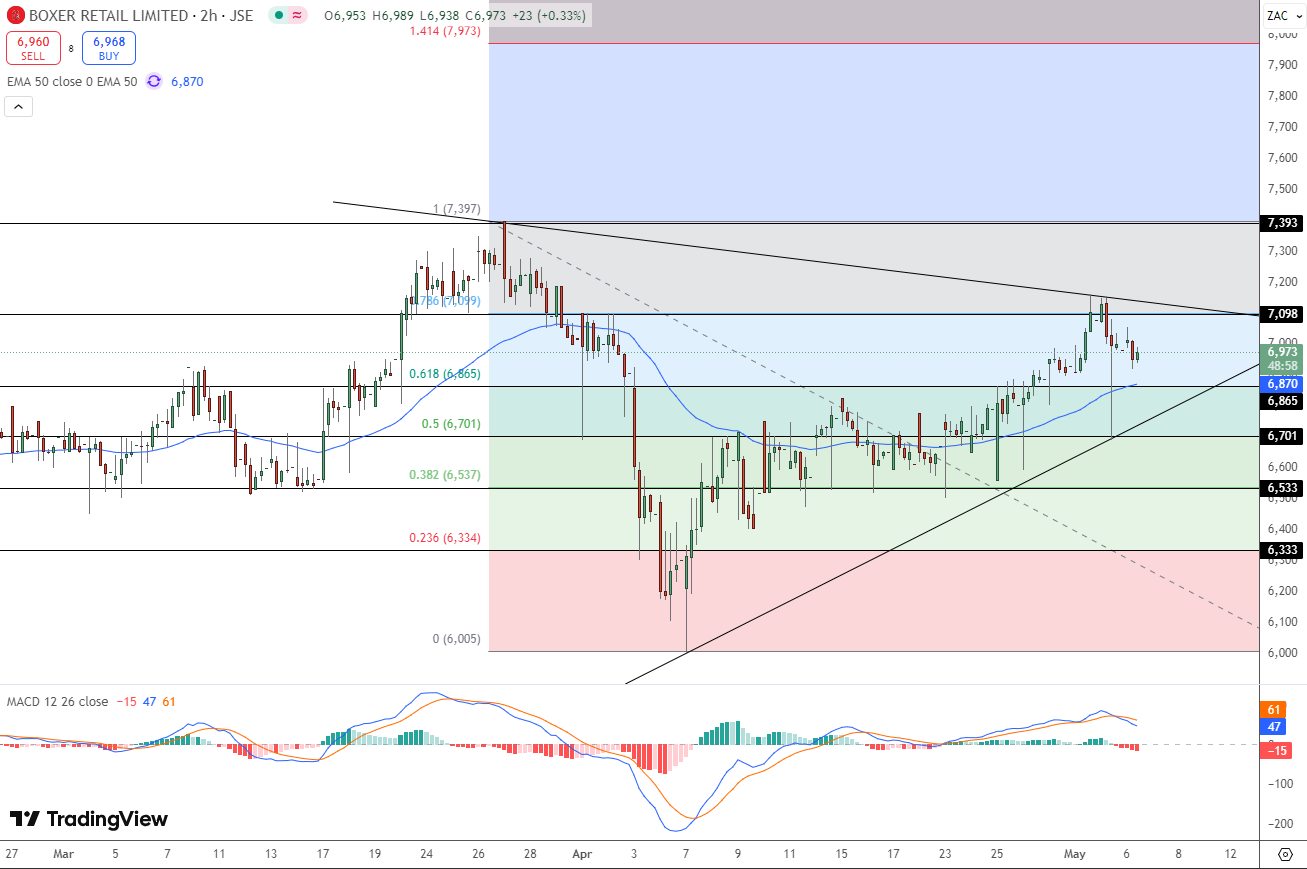
Boxer Retail (JSE: BOX.JO) is approaching a make-or-break moment. After rebounding from a low of 6,005 in April, the share price surged toward 7,098—just shy of its descending trendline and 78.6% Fibonacci retracement level. That barrier has proven resilient, with recent price action showing signs of hesitation. The current support rests at the 50-period EMA of 6,870, a key short-term gauge. Below that, 6,865 marks the crucial horizontal support. If that level cracks, downside pressure could send the stock toward 6,701 or even 6,533.
Meanwhile, momentum indicators suggest fatigue. The MACD histogram is fading, and the signal lines have crossed bearish. Price needs to reclaim 7,098 convincingly to flip the bias back in favor of the bulls.
Key technical takeaways:
-
Resistance zone: 7,098–7,393
-
Support levels: 6,865 → 6,701 → 6,533
-
MACD: Bearish crossover developing
-
50 EMA: Holding at 6,870
Valuation Metrics Show Mixed Signals
From a valuation standpoint, Boxer Retail trades at a trailing P/E of 25.50—above the JSE’s retail average but potentially justified by its 10.62% annual return over the past year. The Price/Book ratio of 30.88 appears stretched, reflecting premium investor expectations for future growth. However, revenue remains strong at 39.53 billion, with a net income of 1.44 billion and a diluted EPS of 2.74.
The company boasts a market cap of 31.93 billion, yet its 239.66% debt-to-equity ratio raises concerns about balance sheet risk in a rising rate environment.
Fundamental snapshot:
-
Market Cap: 31.93B
-
P/E Ratio: 25.50
-
Net Income (ttm): 1.44B
-
ROE & ROA: Not disclosed
-
Total Cash: 219M
Trade Setup: Watch the Breakout Zone
For short-term traders, the 7,098 resistance is the level to watch. A clear breakout here could unleash a rally toward 7,393. But with MACD momentum softening and price stalling below key trendlines, a dip remains in play.
Suggested trade setups:
-
Buy above 7,100, target 7,390, stop loss at 6,865
-
Sell below 6,865, target 6,701, stop loss at 7,050
The current zone is narrow, so discipline is essential. Wait for a strong candle close and avoid premature entries. Let the market show its hand before you act.
- Check out our free forex signals
- Follow the top economic events on FX Leaders economic calendar
- Trade better, discover more Forex Trading Strategies
- Open a FREE Trading Account
- Read our latest reviews on: Avatrade, Exness, HFM and XM
Related Articles
Sidebar rates
