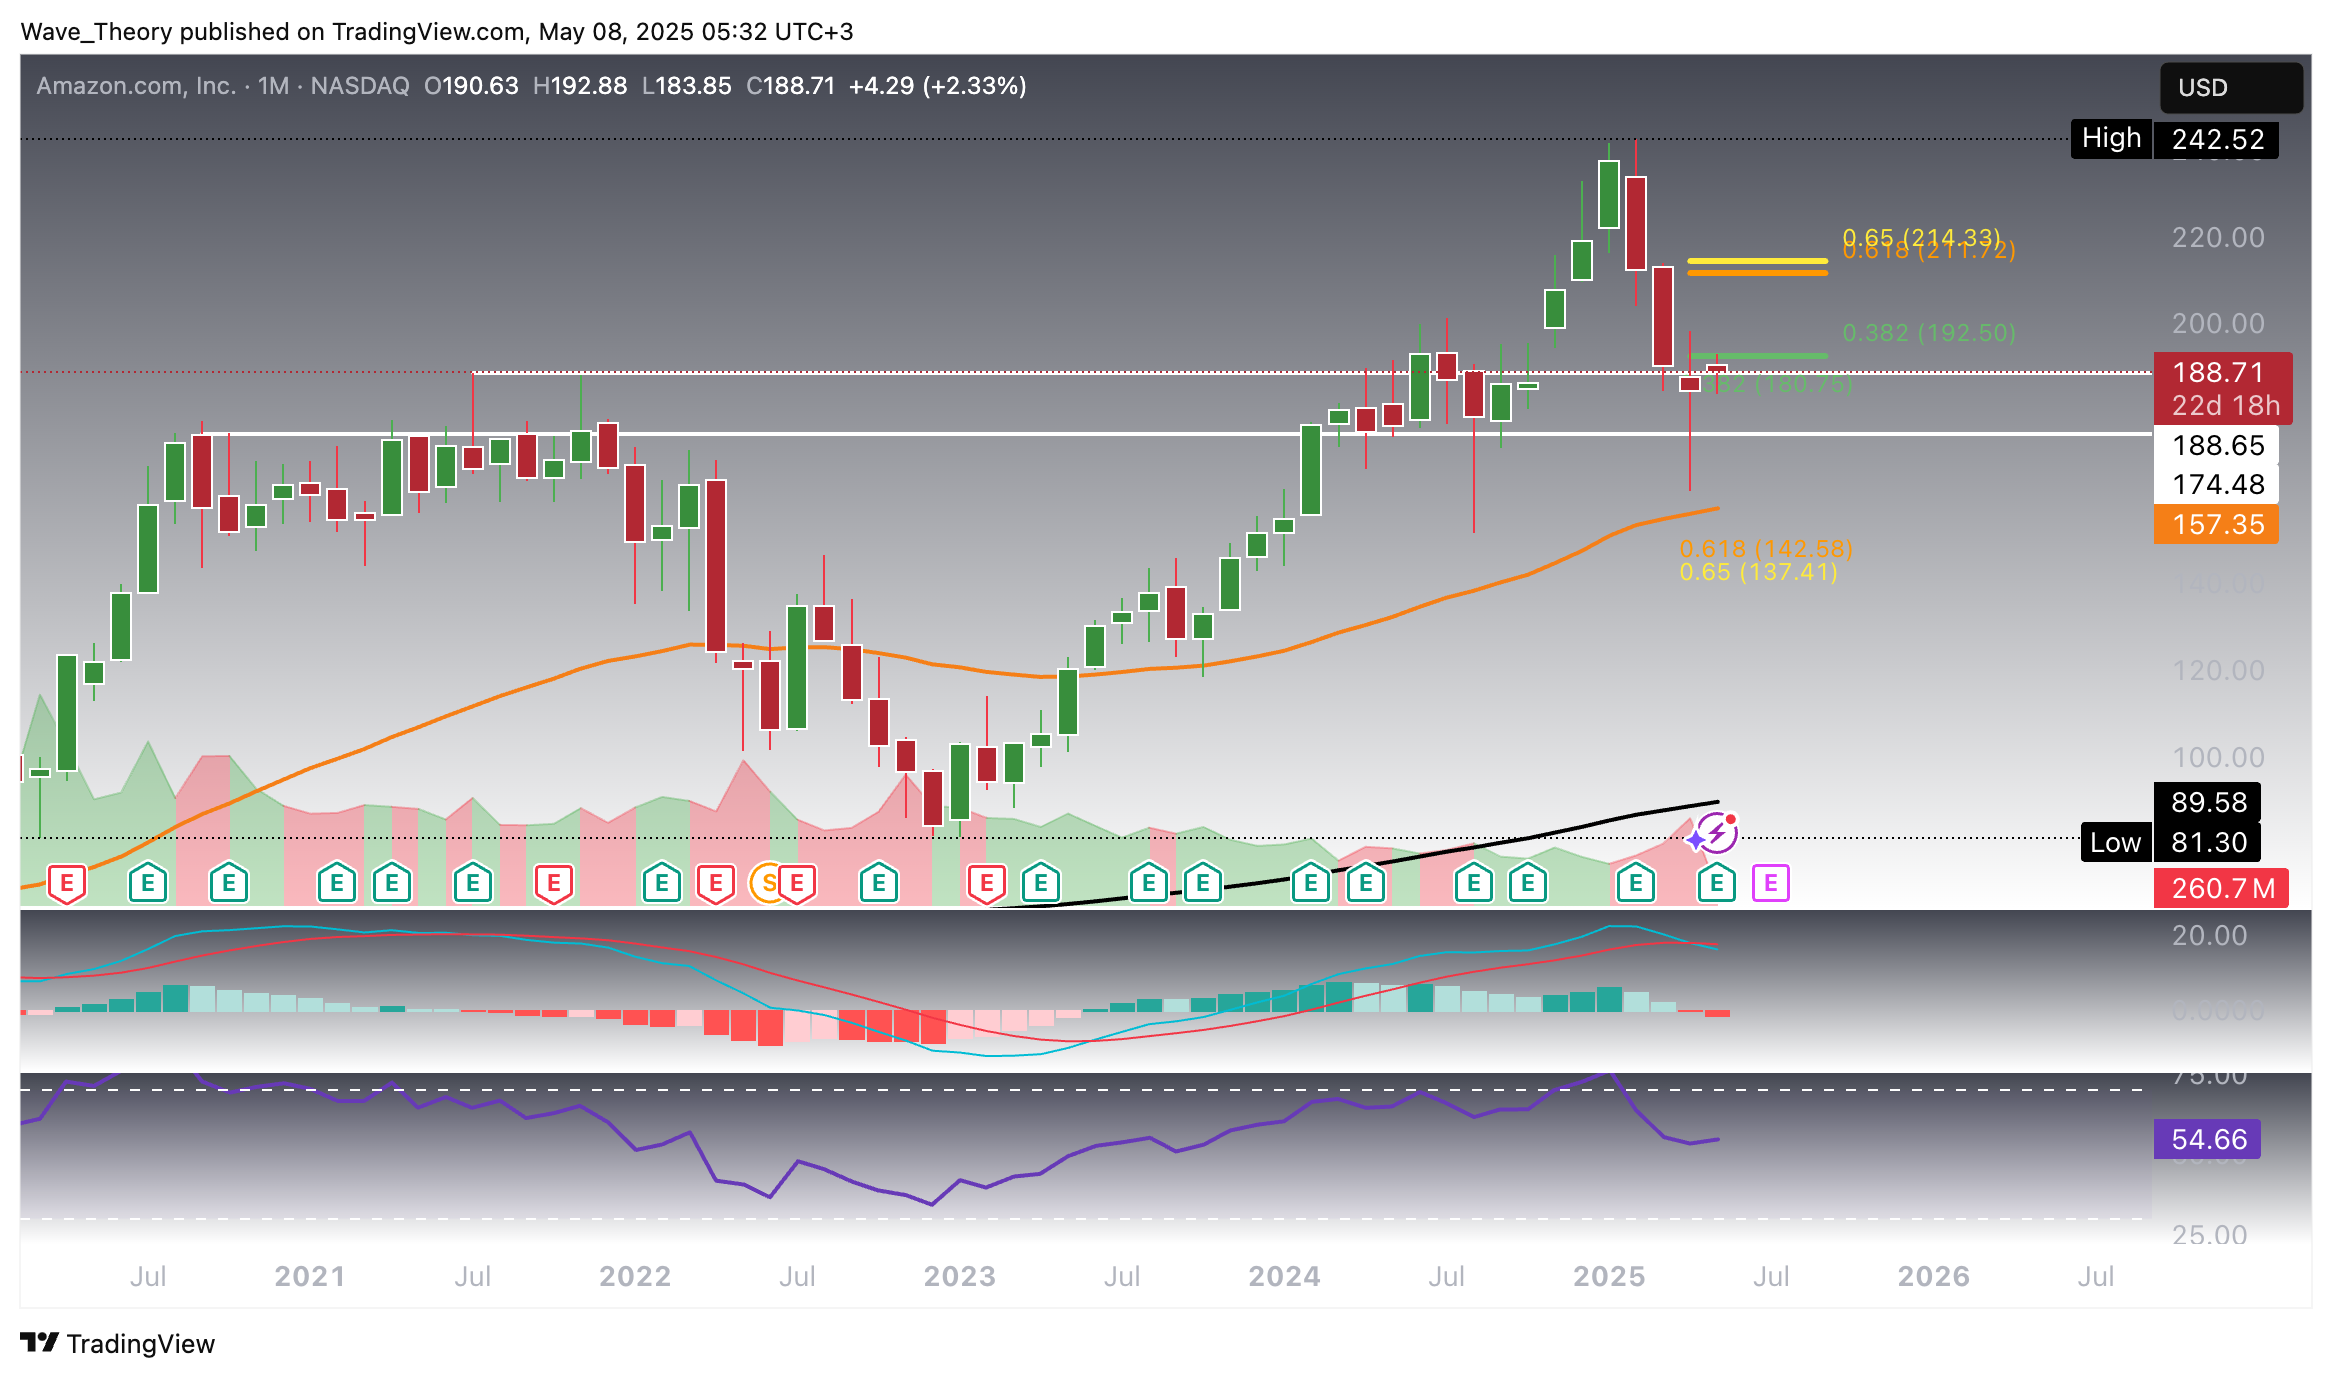
From February to mid-April, Amazon stock (AMZN) faced a significant correction, plunging over 33.3%. However, after reaching a temporary low near $161, it has since staged a rapid recovery, regaining momentum.
Amazon (AMZN) Stock Corrects 33% Before Rapidly Rebounding 20%
Konstantin Kaiser•Thursday, May 8, 2025•2 min read

Quick overview
- Amazon stock (AMZN) experienced a significant correction of over 33% from February to mid-April but has since rebounded by approximately 20%.
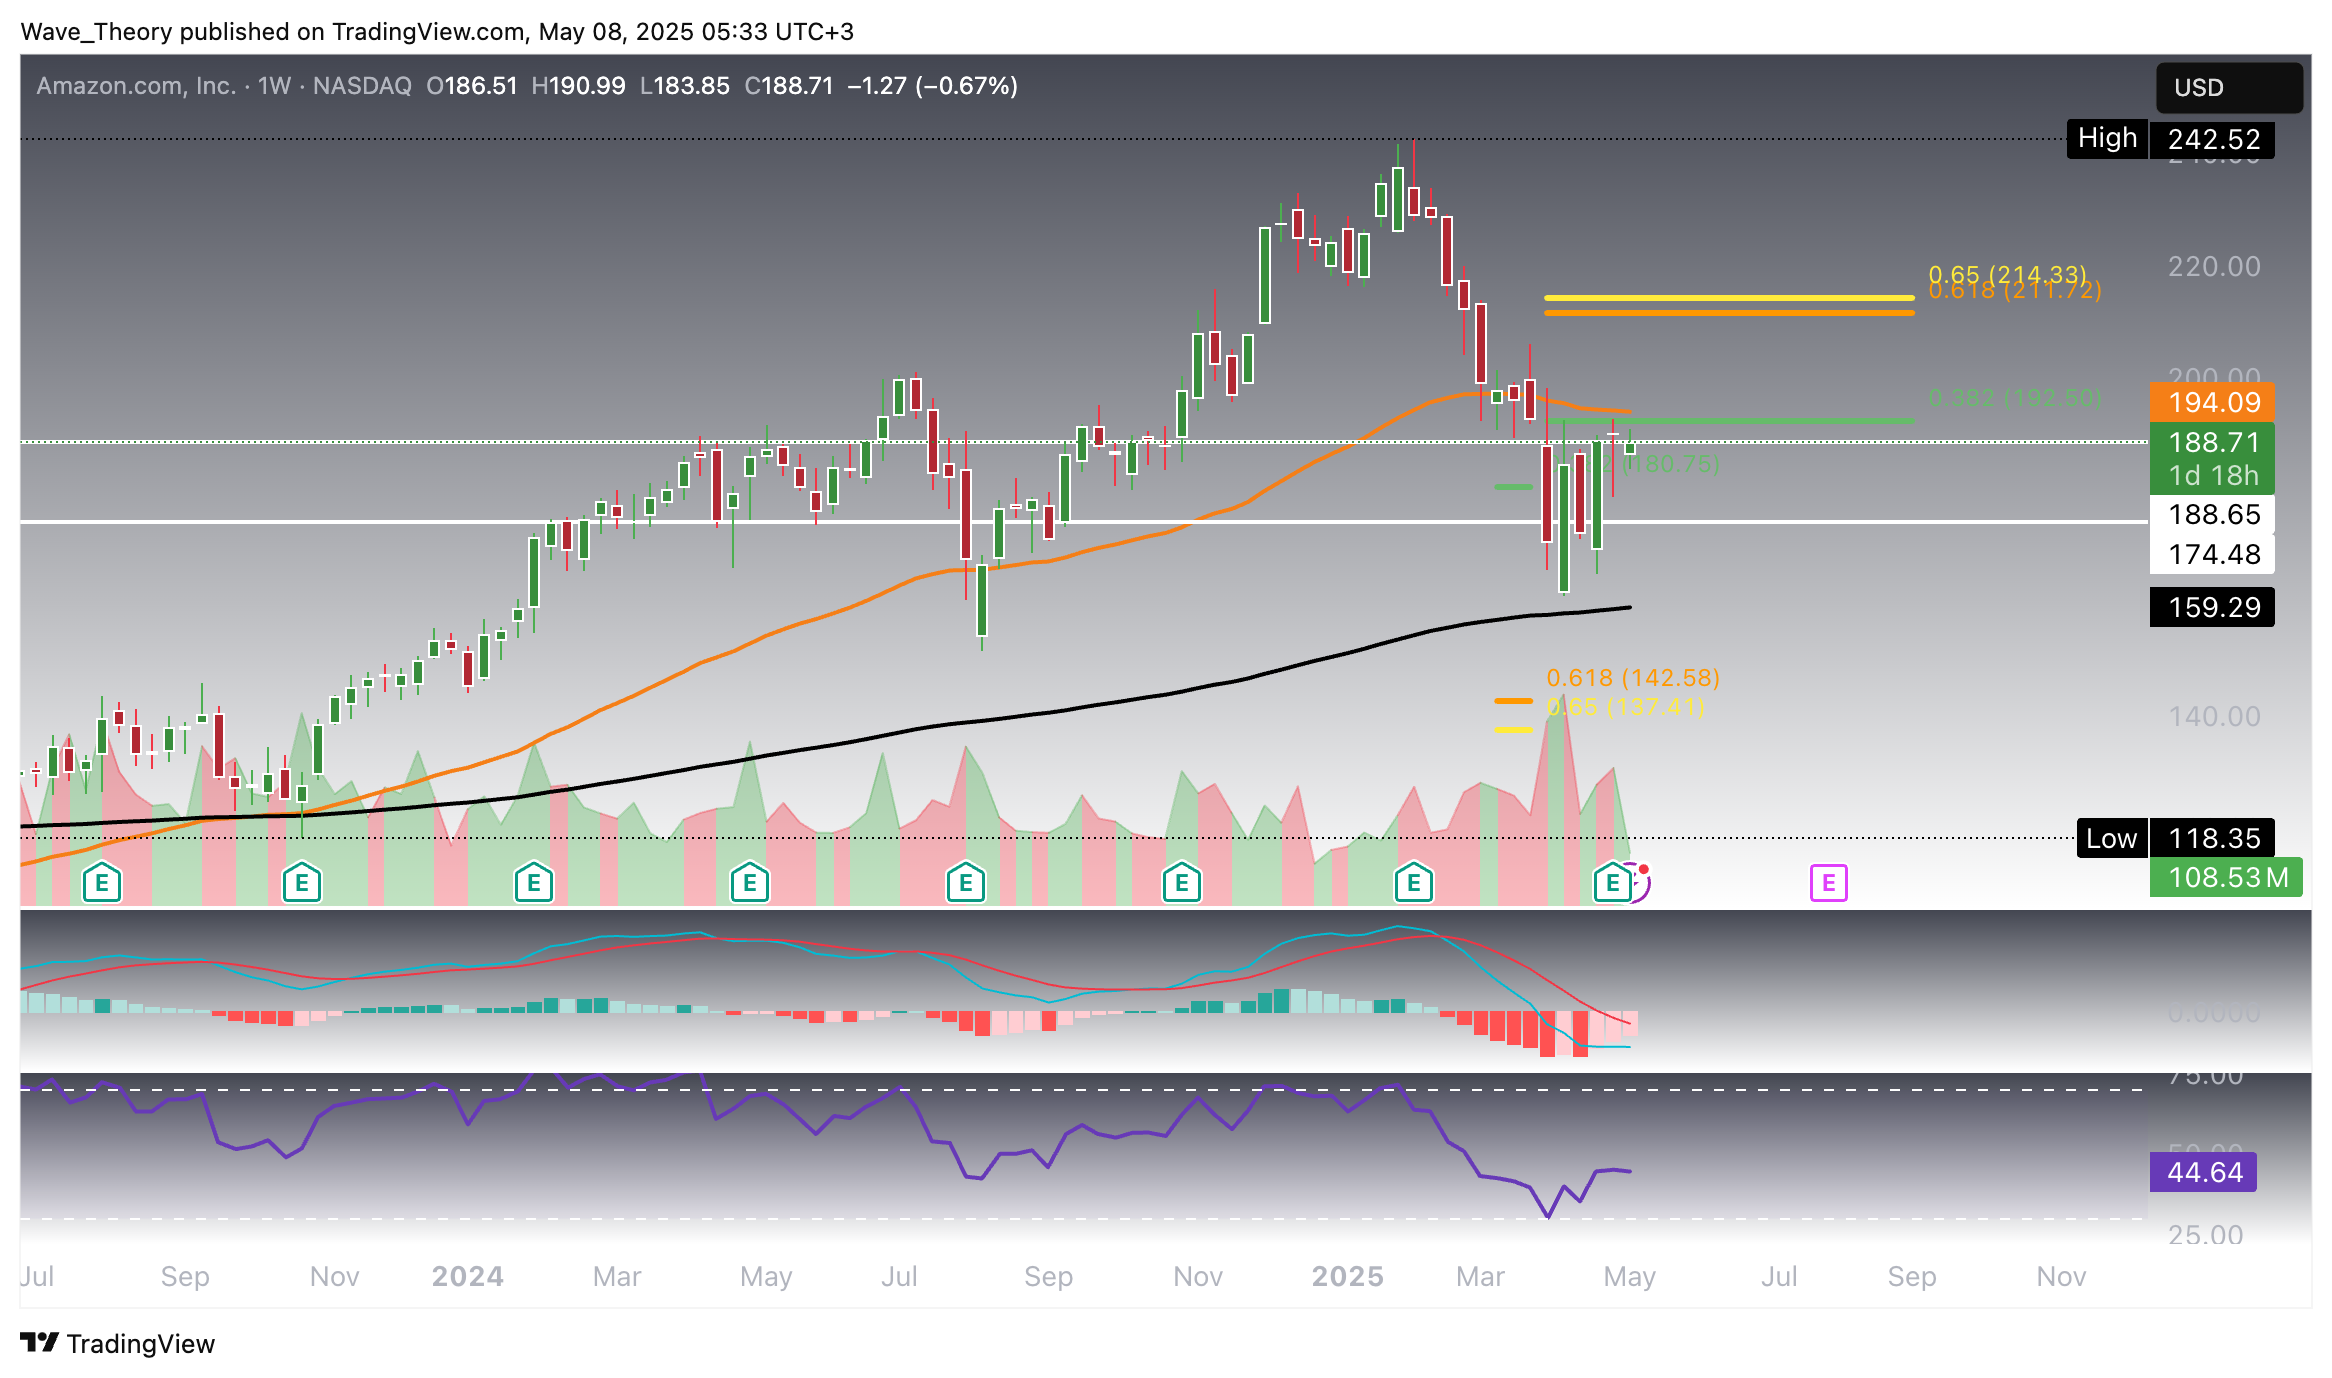
- The stock is currently facing critical Fibonacci resistance at $192.50, with a potential breakout leading to further gains towards $214.
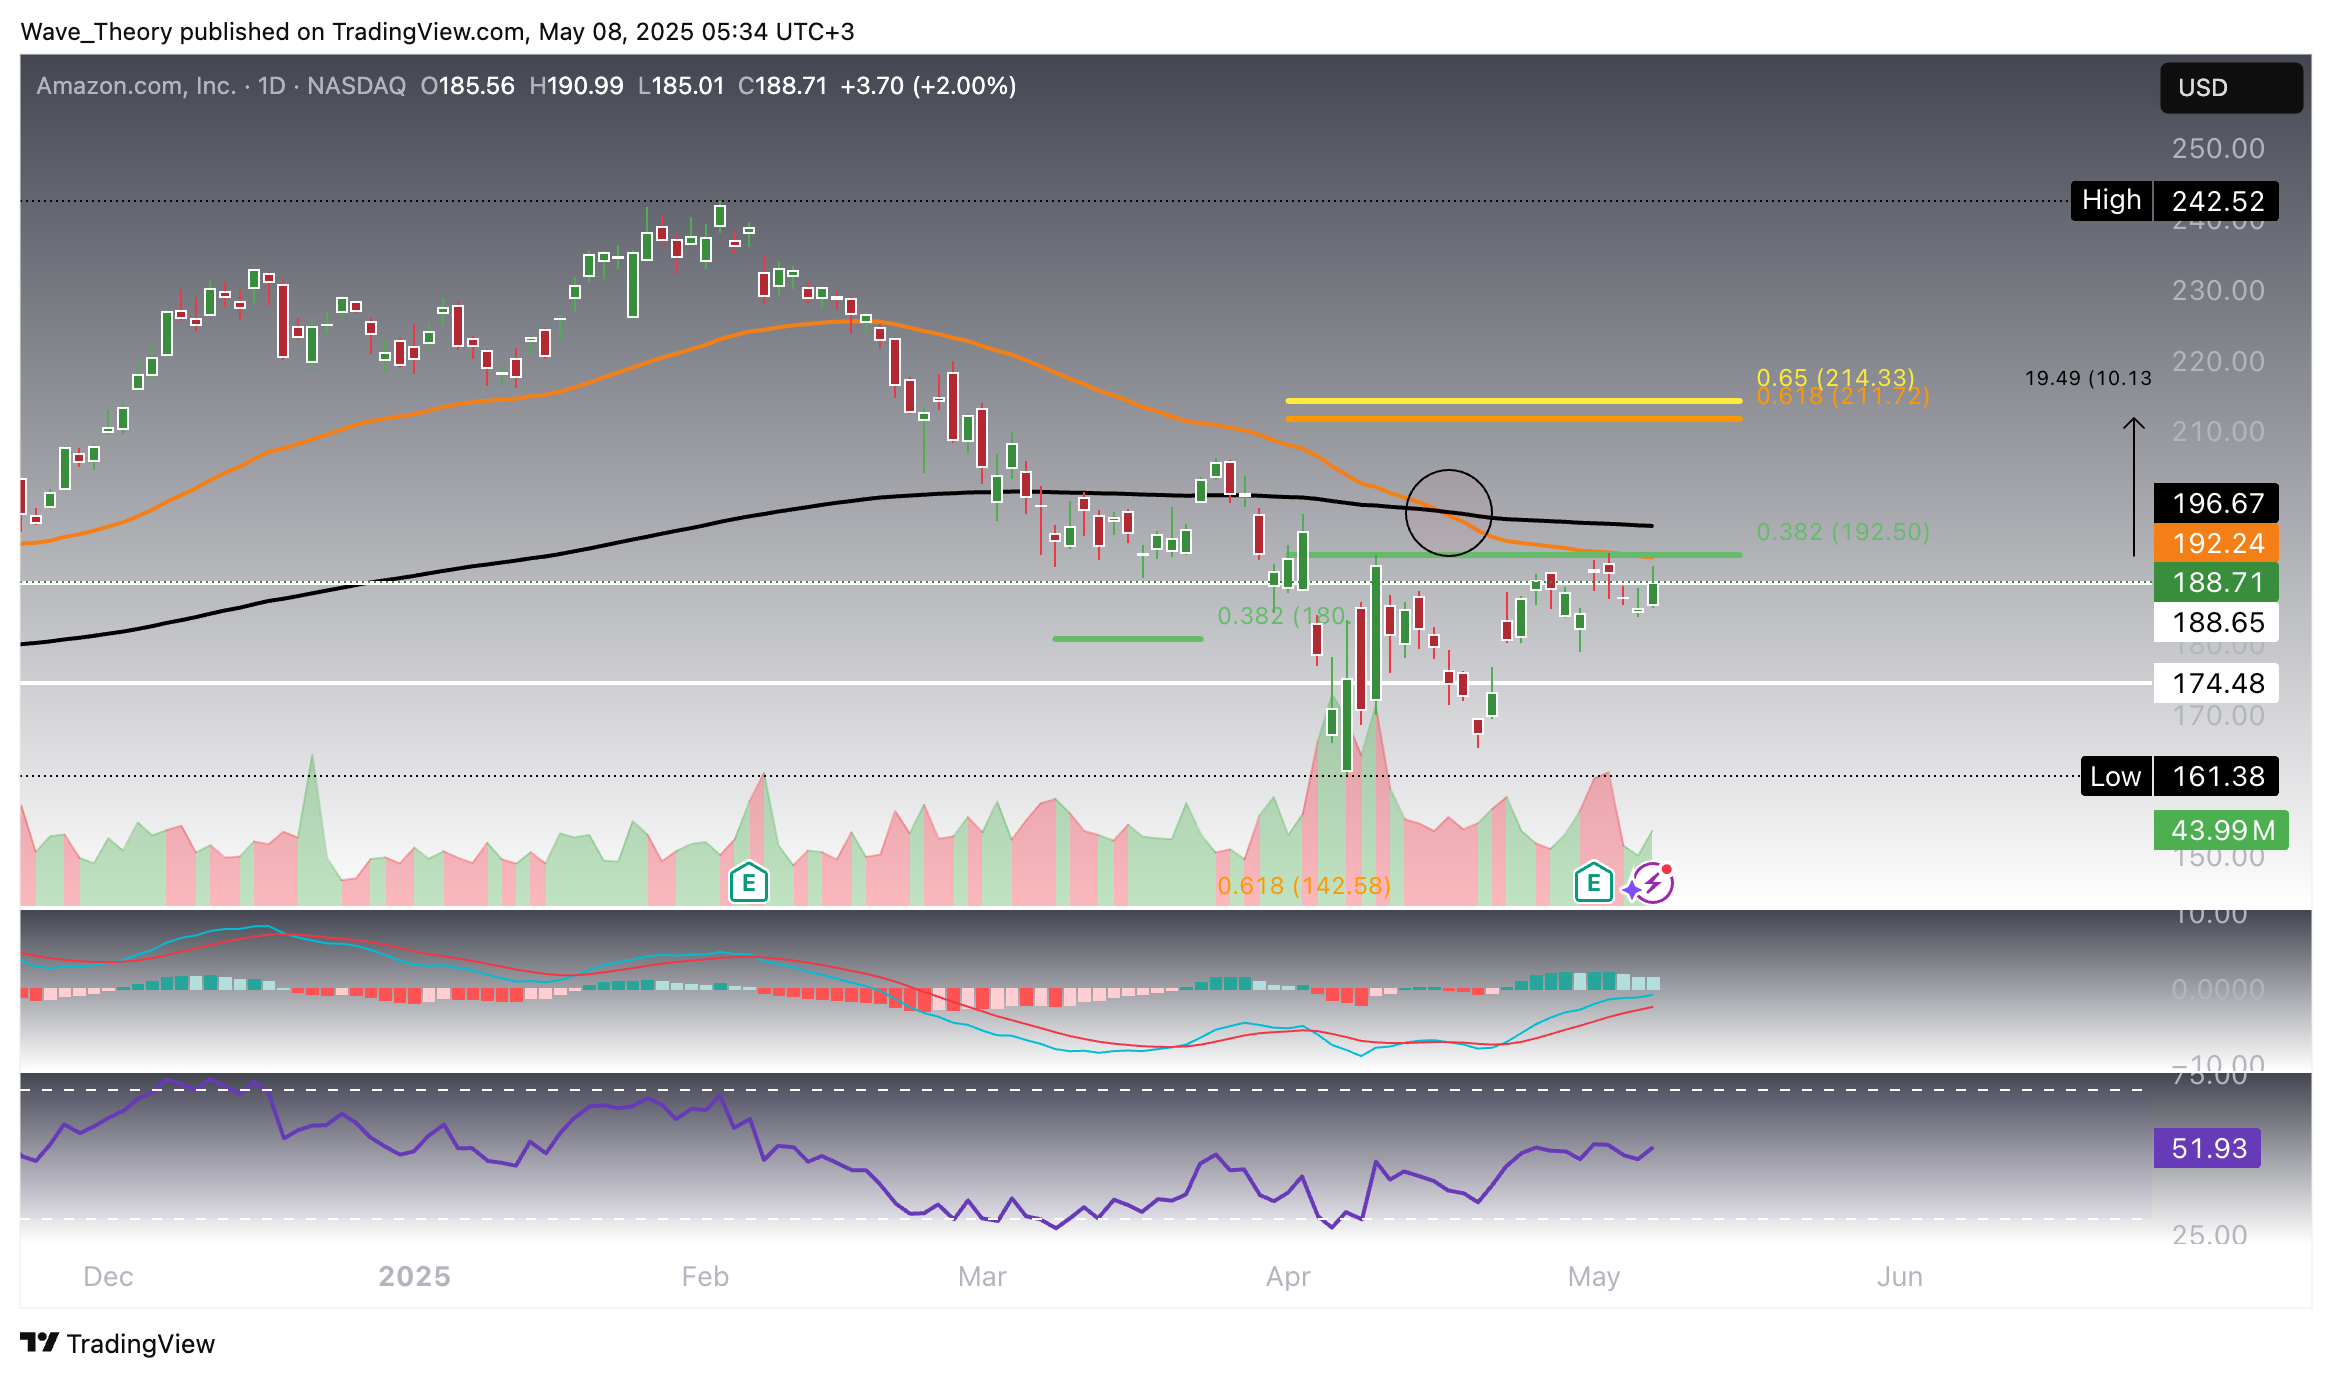
- Despite some bullish momentum indicated by the MACD histogram, the formation of a death cross on the daily chart suggests a bearish trend in the short- to medium-term.
- If Amazon fails to break the 0.382 Fibonacci resistance, it may trigger another correction, potentially dropping to support at $142.50.
Amazon (AMZN) Stock Hits Significant Fibonacci Resistance
Amazon stock (AMZN) has faced a steep decline of more than 33% over the past three months, with the monthly chart reflecting a bearish shift as the MACD lines have crossed to the downside and the histogram indicates a continuing bearish trend. However, the stock has rebounded by approximately 20%, reaching critical Fibonacci resistance at $192.50. A breakout above this level could pave the way for a further rally toward the golden ratio at $214, where the correction phase would officially be considered over. Beyond the golden ratio, Amazon could target its previous high at $242.50 or potentially exceed it, signaling a full recovery and resumption of the uptrend.

Amazon (AMZN) Faces Additional Resistance At The 50-Week-EMA
Amazon (AMZN) faces additional resistance just above the 0.382 Fibonacci level at the 50-week EMA, currently at $194. Despite this, the MACD histogram has been ticking higher over the past three weeks, indicating increasing bullish momentum. While the MACD lines remain bearishly crossed, the EMAs continue to display a golden crossover, reinforcing the bullish outlook for the mid-term. The RSI, however, remains neutral, providing no clear directional signal at this point.

Amazon Stock Faces Bearish Signal: Death Cross On The Daily Chart
On the daily chart, the MACD lines are bullishly crossed, and the RSI remains in neutral territory. However, the MACD histogram has been ticking lower for the past three days, and the EMAs have formed a death cross, indicating a bearish trend in the short- to medium term. If Amazon faces rejection at the 0.382 Fibonacci resistance at $192.50, it could trigger another correction wave, potentially leading the price down to the golden ratio support at $142.5.

Short-Term Bearish Signal for Amazon (AMZN): Similar Outlook On The 4H-Chart
On the 4H chart, technical indicators for Amazon (AMZN) align with a short-term bearish outlook. The EMAs have formed a death cross, confirming a bearish trend, while the MACD lines are bearishly crossed and the RSI remains in neutral regions. However, the MACD histogram is ticking higher, suggesting some bullish momentum in the very short term. If Amazon breaks the 0.382 Fibonacci resistance, it could surge toward the golden ratio resistance at $214. A successful breakout above this level would signal further upside potential.

- Check out our free forex signals
- Follow the top economic events on FX Leaders economic calendar
- Trade better, discover more Forex Trading Strategies
- Open a FREE Trading Account
ABOUT THE AUTHOR
See More
Konstantin Kaiser
Financial Writer and Market Analyst
Konstantin Kaiser comes from a data science background and has significant experience in quantitative trading. His interest in technology took a notable turn in 2013 when he discovered Bitcoin and was instantly intrigued by the potential of this disruptive technology.
Related Articles
Comments
0
0
votes
Article Rating
Subscribe
Login
Please login to comment
0 Comments
Oldest
Newest
Most Voted
Inline Feedbacks
View all comments
Sidebar rates
HFM
Related Posts
Doo Prime
XM
Best Forex Brokers
