Gold Price Forecast: Dollar Dips, Gold Pops—$3,500 in Sight?
Gold (XAU/USD) has now gone up for three days in a row, hitting $3,333 and a new one-week high. The dollar index (DXY) fell 0.6%

Quick overview
- Gold (XAU/USD) has risen for three consecutive days, reaching a new one-week high of $3,333.
- The dollar index (DXY) has decreased by 0.6%, making gold more appealing to global investors amid rising macro risks.
- Geopolitical tensions, particularly regarding Israel and Iran, are reinforcing gold's safe-haven appeal.
- Technical analysis shows gold has broken out of a descending channel, with immediate resistance at $3,358 and support levels at $3,320 and $3,290.
Gold (XAU/USD) has now gone up for three days in a row, hitting $3,333 and a new one-week high. The dollar index (DXY) fell 0.6% and gold is looking more attractive to global buyers. With Wall Street pulling back and bond yields up, investors are fleeing to non-yielding assets as macro risk is high.
The debate around President Trump’s tax bill has brought back fears of a ballooning fiscal deficit and US assets are getting hit. As market strategist Daniel Pavilonis said: “We’re in a holding pattern, waiting for clarity on trade and fiscal direction.”
While the US-China trade war is cooling down for now, a Reuters survey shows economists still see the US economy as fragile.
Rising Tensions, Strong Technicals Support Bullish Bias
Gold’s safe-haven role is being reinforced by geopolitical tensions. CNN is reporting new intelligence that Israel may strike Iranian nuclear sites, global implications are high. Historically this kind of developments increase demand for gold as a geopolitical hedge.
Meanwhile ANZ is expecting the recent dip to attract investment demand, “persistent macroeconomic and political instability” is supporting the bullish momentum in gold.
-
Dollar index down 0.6%
-
Wall Street is down, bond yields up
-
Record high: $3,500.05 (last month)
-
ANZ: “Dip will attract investment demand”
Gold Technical Breakout Sets Up for Higher Targets
From a charting perspective gold has broken out above the descending channel that contained the price since early May. The move was confirmed by a bullish engulfing candle and higher lows, the 50-EMA ($3,274) is now the dynamic support.
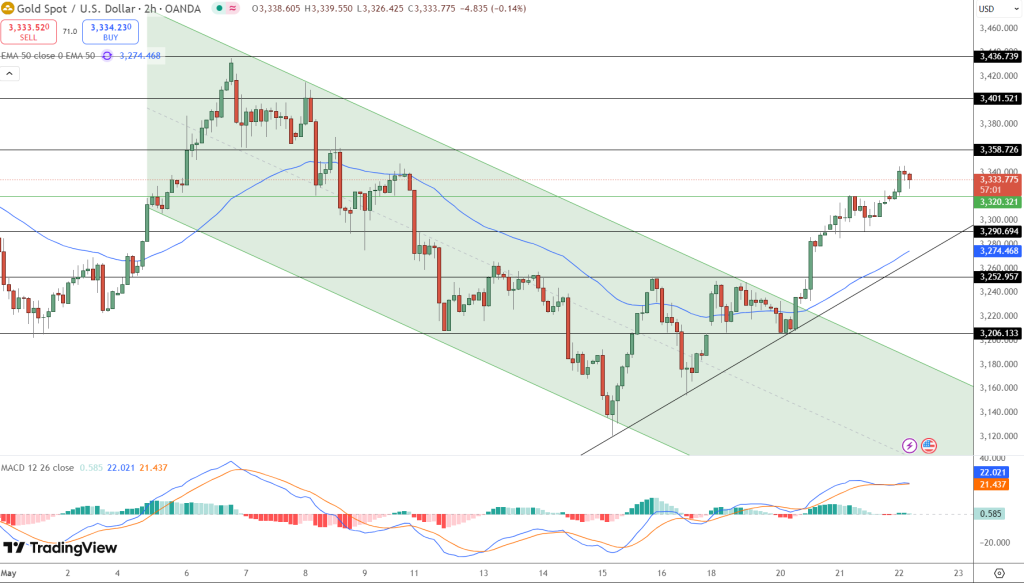
MACD is bullish and price has reclaimed $3,290 and $3,320—both former resistance zones—now become near term support.
Key Levels:
-
Immediate resistance: $3,358
-
Next upside targets: $3,401 and $3,436
-
Support: $3,320 and $3,290
-
Risk invalidation: Below the ascending trendline near $3,274
Newbies buy above $3,358 or on retest of $3,320-$3,290 if it holds.
- Check out our free forex signals
- Follow the top economic events on FX Leaders economic calendar
- Trade better, discover more Forex Trading Strategies
- Open a FREE Trading Account
- Read our latest reviews on: Avatrade, Exness, HFM and XM
Related Articles


Sidebar rates
Related Posts
