XRP Set to Tumble? Peter Brandt Sees $1.07 as Head-and-Shoulders Pattern Forms
XRP hovers at $2.35 as a head-and-shoulders pattern hints at a drop to $1.07. Ripple’s strong fundamentals offset bearish signals.
Quick overview
XRP’s price action has caught the attention of Peter Brandt, a veteran trader who has just flagged a classic head-and-shoulders (H&S) pattern. This formation – which signals a reversal from uptrends – suggests XRP could drop from $2.35 to $1.07. Brandt’s call is big, especially considering his previous prediction of a $27 move in 60 days.
Technical indicators are bearish:
- XRP has a key resistance at $3; a break above that could trigger a correction.
- $1.90 is the support line; below that and it’s a free fall to $1.07.
- The H&S pattern with three peaks and a neckline at $1.90 is bearish.
- Price action is indecisive with spinning tops and small bodied candles, showing market hesitation.
Ripple’s Fundamentals Counter the Technical View
While Brandt’s technical view is bearish, Ripple’s fundamentals are a counterweight. Recent developments include:
- XRP ETF approval odds have jumped 83% and Grayscale, Bitwise and Coinshares have filed for regulatory approval.
- The first ever 1x XRP ETF has been launched by Volatility Shares and that has sparked fresh interest in the market.
- Ripple’s XRP Ledger is getting an upgrade that will increase scalability, challenging Ethereum and Solana.
- Social media buzz is at an all time high with Ripple’s new partnerships and acquisitions.
- A favorable court ruling in the Ripple vs SEC case has boosted investor sentiment.
So while the technicals say be cautious, the fundamentals say XRP is resilient.
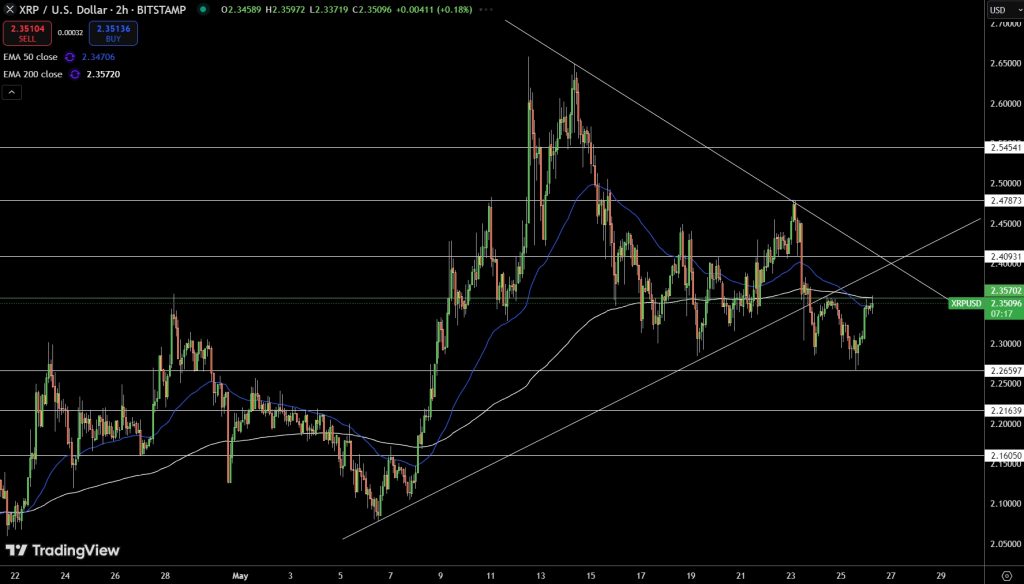
XRP/USD Setup for Traders: Watch These Levels
XRP/USD is currently at $2.35 with a 24 hour volume of $2.15 billion. The 2 hour chart is bouncing from $2.27 support but resistance is near $2.41. The MACD is hinting at a bullish crossover but confirmation is lacking.
Trade considerations:
- Bullish break above $2.41 with volume could target $2.48-$2.54.
- Bearish breakdown below $2.27 could push to $2.21 or lower.
- Wait for momentum and candlestick confirmation before entering trades.Wait.
- Check out our free forex signals
- Follow the top economic events on FX Leaders economic calendar
- Trade better, discover more Forex Trading Strategies
- Open a FREE Trading Account
- Read our latest reviews on: Avatrade, Exness, HFM and XM
Related Articles


Sidebar rates
Related Posts
