Forex Signals Brief July 8: Will Stocks Continue the Retreat Today?
Yesterday US stocks turned lower, ending last week's rally on tariff talk, so the decline might continue today as well.
•
Last updated: Monday, July 7, 2025

Quick overview
- US stocks declined yesterday, ending last week's rally amid renewed tariff discussions.
- The USD initially strengthened but faded as markets reacted to President Trump's tariff announcements, which included 25% tariffs on imports from South Korea and Japan.
- Gold prices rebounded after sharp losses due to increased safe-haven demand following the formal tariff announcement.
- The Reserve Bank of Australia cut rates to 3.60% in response to soft inflation and growth, raising concerns about the fragility of the economic recovery.
Yesterday US stocks turned lower, ending last week’s rally on tariff talk, so the decline might continue today as well.
Early USD Strength Fades Before Renewed Tariff Shock
Markets opened the week with early U.S. dollar strength after traders quickly dissected President Trump’s initial announcement of new tariff levels and timelines, spotting ambiguities and potential loopholes. By the time European markets closed, much of that initial dollar demand had faded—completely, in fact, against the British pound.
However, sentiment quickly reversed again after a more concrete announcement followed: 25% tariffs on imports from South Korea and Japan set to begin August 1. The move stoked fears of renewed trade tensions and added five more countries to the tariff list, triggering a second wave of risk aversion and renewed USD buying.
Euro, Yen React to USD Buying Waves
During this second round of dollar strength, the euro slipped to a session low of 1.1688 but found solid buying interest, recovering to 1.1720 late yesterday. Elsewhere, previous dollar extremes held steady in most major pairs, but the Japanese yen was the notable exception, experiencing steady selling pressure throughout the day. It weakened from 144.25 in early Asian trading to 146.10 by the close, reflecting persistent capital outflows and a continued global yield chase that have weighed on the currency.
Oil Bounces Despite OPEC Supply Concerns
Oil markets also saw significant volatility. Prices initially dropped by $2 on news of increased OPEC supply but reversed course later in the session, ending $1 higher. Analysts suggested that there is an ongoing “post-OPEC squeeze,” as real supply cuts may not have been as deep as producers claimed. Meanwhile, global stockpiles continue to appear tight, adding to the upward pressure.
Gold Rebounds from Sharp Intraday Losses
Gold prices initially fell sharply in Asian trading, dropping $35 on the tariff headlines, but steadily clawed back those losses as safe-haven demand increased after the formal tariff announcement. By the close, gold finished higher on the day, signaling that geopolitical uncertainty is still supporting the precious metal despite ongoing volatility.
Today’s Market Events: RBA Cuts Rates Amid Soft Inflation and Growth
In Australia, the Reserve Bank of Australia (RBA) implemented a widely expected 25 basis point rate cut, lowering the cash rate from 3.85% to 3.60%. The move followed a softer-than-expected inflation report, which showed annual price growth of just 2.1% year over year, barely above the RBA’s 2% target and below its own forecasts.
While this is seen as encouraging for controlling inflation, Westpac analysts warned that the Bank remains concerned about underlying price pressures. Economic growth has also been muted, with Q1 GDP printing at just 0.2% quarter over quarter, underscoring the fragility of the recovery. Markets will be closely watching the RBA’s guidance for signs of whether it will continue cutting or pause to assess the impact.
Last week, markets were slower than what we’ve seen in recent months, with gold retreating as a result, the EUR/USD jumping above 1.18 but returned back below it, while S&P and Nasdaq retreated yesterday, but Dow Jones kept pushing higher. The moves weren’t too big though, and we opened 35 trading signals in total, finishing the week with 23 winning signals and 12 losing ones.
Gold’s Technical Picture Turns Cautious but Stabilizes
Despite recent rallies, gold remains in a precarious technical position. After its spectacular run in April to record highs near $3,500 per ounce, the metal recently broke decisively below its 50-day simple moving average, a level that had offered nearly a year of reliable support. That breakdown raised the risk of deeper declines, pushing traders’ focus to the 100-day moving average near $3,150 as the next major support.
However, despite those concerns, buying demand has returned this week, suggesting that if the rally holds, there could be further stabilization in the days ahead.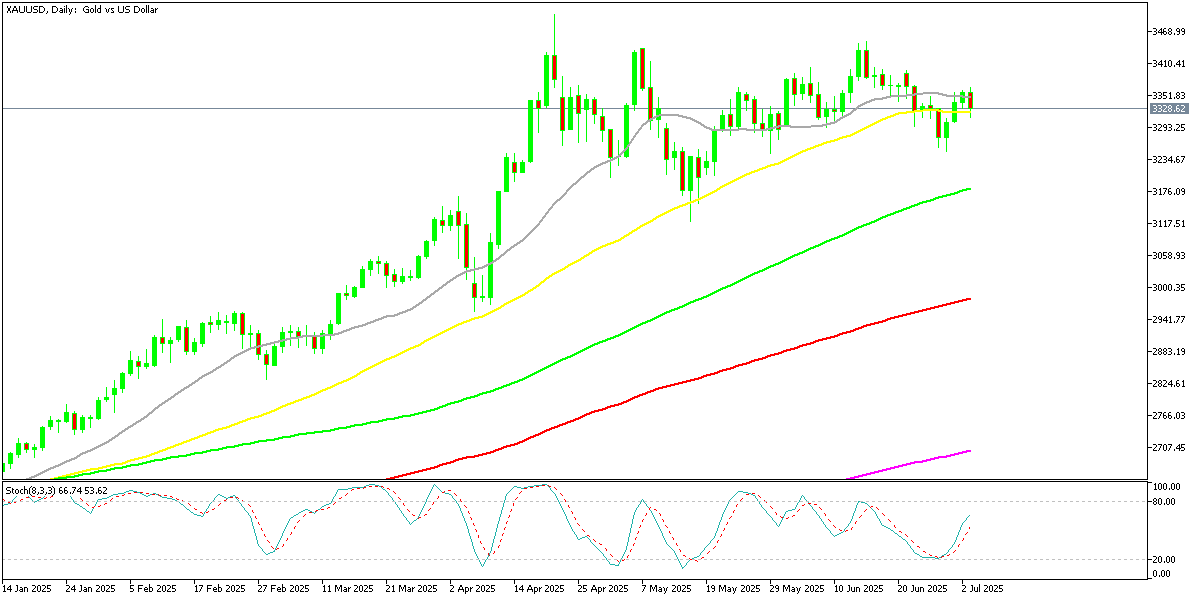
Yen Slides as Yield Chasing Intensifies
The USD/JPY pair also saw significant movement earlier this week, climbing from 143.40 to 148. Analysts attributed the yen’s decline to continued capital outflows from Japan and the global hunt for higher yields, which have pressured the currency for months.
That said, the pair once again encountered firm resistance at its 100-week simple moving average, highlighting the need for a clear shift in investor risk appetite or policy outlook to trigger a sustained breakout above these levels.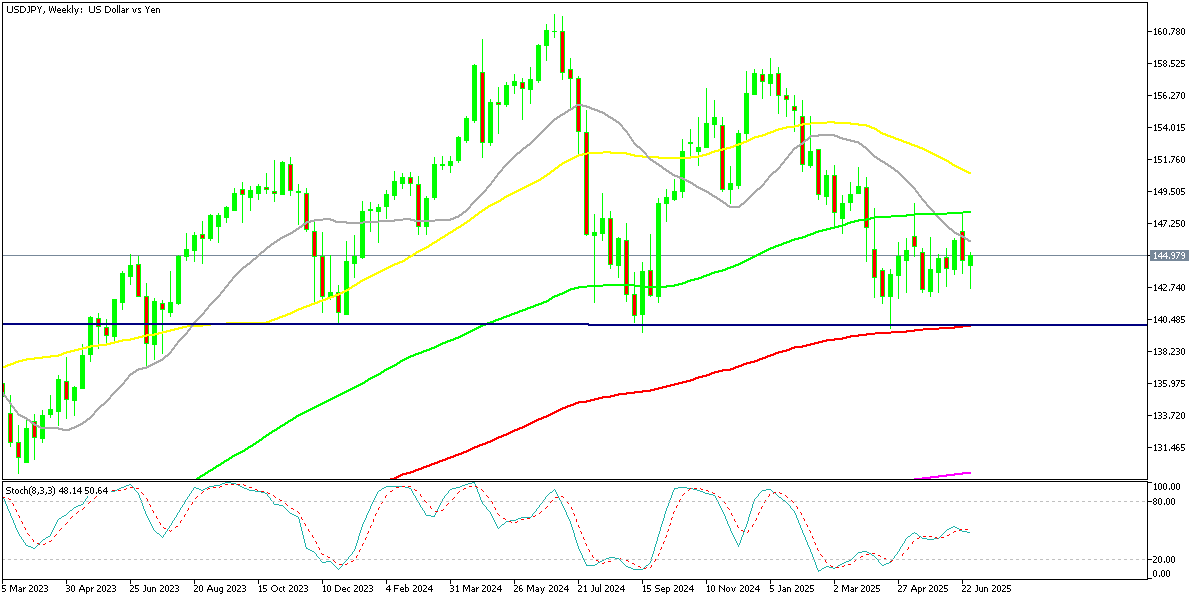
USD/JPY – Weekly Chart
Cryptocurrency Update
Crypto Markets See Wild Swings
Cryptocurrency markets mirrored broader financial volatility. Bitcoin faced selling pressure earlier in the week, breaking below its 50-day moving average and briefly plunging below the $100,000 mark for the first time since early May. Yet longer-term investors quickly stepped in around the 20-week simple moving average, sparking a sharp $10,000 rebound that by week’s end had Bitcoin trading back toward $108,000. This critical support zone once again proved vital in maintaining confidence among dedicated holders.
BTC/USD – Weekly chart
Ethereum Outpaces Bitcoin on Institutional Support
Ethereum, meanwhile, has been even stronger. It is up more than 20% since April, consistently outperforming Bitcoin in recent weeks. Much of that momentum has been driven by a resurgence of institutional buying and mounting anticipation for its next Pectra upgrade, which is expected to further strengthen Ethereum’s role in the blockchain ecosystem.
Technically, ETH is now testing its 200-day moving average, a crucial level for traders. A decisive break above this threshold would open the door to the $4,000 zone, potentially cementing Ethereum’s lead over Bitcoin through the summer and reinforcing its appeal to investors seeking blockchain exposure.
ETH/USD – Daily Chart
- Check out our free forex signals
- Follow the top economic events on FX Leaders economic calendar
- Trade better, discover more Forex Trading Strategies
- Open a FREE Trading Account
- Read our latest reviews on: Avatrade, Exness, HFM and XM
ABOUT THE AUTHOR
See More
Skerdian Meta
Lead Analyst
Skerdian Meta Lead Analyst.
Skerdian is a professional Forex trader and a market analyst. He has been actively engaged in market analysis for the past 11 years. Before becoming our head analyst, Skerdian served as a trader and market analyst in Saxo Bank's local branch, Aksioner. Skerdian specialized in experimenting with developing models and hands-on trading. Skerdian has a masters degree in finance and investment.
Related Articles


Sidebar rates
Related Posts
