Forex Signals Brief July 10: Unemployment Claims As Markets Watch for Fed Moves
Markets moved unevenly Wednesday, with forex, stocks, and crypto traders all watching signals of cooling US inflation.

Quick overview
- Forex markets showed mixed signals, with the USD/JPY pair experiencing a sharp reversal after hitting a two-week high, indicating potential strain on the dollar.
- US stock markets closed positively, driven by AI optimism, despite a cautious outlook from the FOMC minutes suggesting limited rate cuts ahead.
- Uncertainty surrounding US trade policy and tariff threats from President Trump may pressure the dollar and disrupt trade flows.
- In the cryptocurrency space, Bitcoin rebounded sharply after dipping below $100,000, while Ethereum outperformed with strong institutional support and anticipation of its upcoming upgrade.
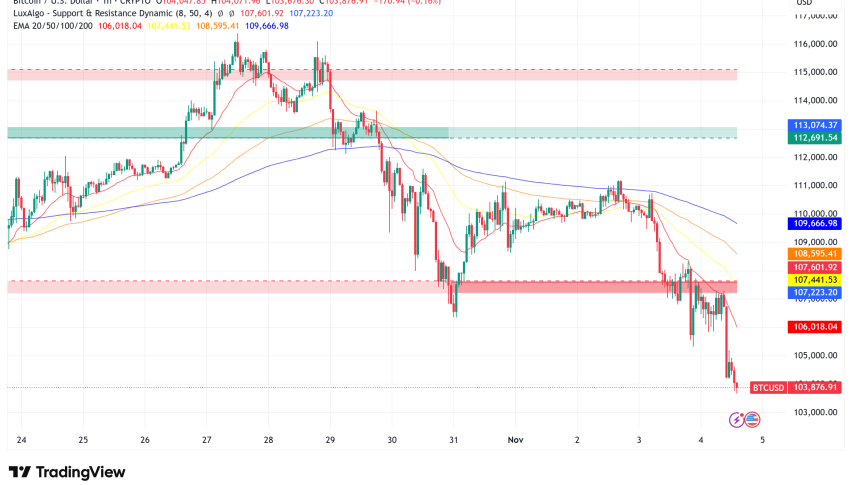
Live BTC/USD Chart
Markets moved unevenly Wednesday, with forex, stocks, and crypto traders all watching signals of cooling US inflation.
FX Markets Mixed as Dollar Shows Signs of Strain
Wednesday’s trading session in the foreign exchange market was largely quiet, but the USD/JPY pair saw a sharp intraday reversal lower after reaching its highest level in two weeks. That slide coincided with US Treasury yields dropping to their session lows, reflecting a shift in risk appetite.
Earlier in the week, the USD/JPY had pushed higher, from 143.40 to 148, buoyed by yield spreads and continued capital outflows from Japan. However, the rally ran into strong resistance near its 100-week simple moving average, underscoring that a sustained breakout might require a more dramatic shift in monetary policy expectations or investor sentiment.
Stock Markets Finish Strong on AI Optimism
Despite drifting early on, US stock markets finished solidly in the green, powered by the ongoing AI trade led by Nvidia and respectable gains in industrials. Traders shrugged off macro data in the short term, but the FOMC minutes revealed a cautious outlook, showing only Waller and Bowman advocating for rate cuts in July. That revelation suggests the greater risk may be no rate cuts at all, which could challenge bullish bets.
Tariff Tensions Cast a Shadow on USD
Meanwhile, uncertainty around US trade policy continues to weigh on sentiment. President Trump’s threats of new tariffs, including against Brazilian commerce despite existing deficits, highlighted the unpredictable nature of tariff negotiations. Analysts warn that partners may abandon negotiations entirely if rhetoric escalates, which could eventually pressure the US dollar by disrupting trade flows and investment confidence.
Today’s Market Events: US Jobless Claims Point to Gradual Labor Market Cooling
One of the day’s clearest macro signals came from US jobless claims data, which continue to suggest a slow cooling of the labor market. Initial claims maintain a four-week average of 242,000, still low by historical standards but up about 2% year over year. More tellingly, the median duration of unemployment has crept up to 10 weeks, indicating that job seekers are taking longer to find new employment.
Analysts at Wells Fargo caution that while the labor market hasn’t “broken,” a steady rise in claims could point to deeper trouble ahead. Slower payroll growth is also anticipated as tariffs raise corporate costs and reduce overall demand, potentially cooling one of the last strong pillars of the US economy.
Last week, markets were slower than what we’ve seen in recent months, with gold retreating as a result, the EUR/USD jumping above 1.18 but returned back below it, while S&P and Nasdaq retreated yesterday, but Dow Jones kept pushing higher. The moves weren’t too big though, and we opened 35 trading signals in total, finishing the week with 23 winning signals and 12 losing ones.
Gold Sticks to the 50 SMA
Gold prices remain under pressure, even after an incredible rally to record highs around $3,500/oz in April. The recent breakdown below the 50-day simple moving average has traders eyeing the 100-day SMA near $3,150 as the next support. This week’s waning buying interest suggests further downside risk in the near term.
Yen Slides as Yield Chasing Intensifies
Meanwhile, USD/JPY volatility persisted earlier this week, with the pair surging from 143.40 to 148 as yield differentials and capital outflows from Japan weighed on the yen. However, the rally ran into stiff resistance near its 100-week simple moving average, reinforcing that a sustained breakout may require a more significant shift in investor risk appetite or monetary policy outlook.
USD/JPY – Weekly Chart
Cryptocurrency Update
Bitcoin Prints New Record High
Cryptocurrency markets mirrored broader financial volatility. Bitcoin faced selling pressure earlier in the week, breaking below its 50-day moving average and briefly plunging below the $100,000 mark for the first time since early May. Yet longer-term investors quickly stepped in around the 20-week simple moving average, sparking a sharp $10,000 rebound that by week’s end had Bitcoin trading back toward $108,000. This critical support zone once again proved vital in maintaining confidence among dedicated holders.
BTC/USD – Weekly chart
Ethereum Outpaces Bitcoin on Institutional Support
Ethereum, meanwhile, has been even stronger. It is up more than 20% since April, consistently outperforming Bitcoin in recent weeks. Much of that momentum has been driven by a resurgence of institutional buying and mounting anticipation for its next Pectra upgrade, which is expected to further strengthen Ethereum’s role in the blockchain ecosystem.
Technically, ETH is now testing its 200-day moving average, a crucial level for traders. A decisive break above this threshold would open the door to the $4,000 zone, potentially cementing Ethereum’s lead over Bitcoin through the summer and reinforcing its appeal to investors seeking blockchain exposure.
ETH/USD – Daily Chart
- Check out our free forex signals
- Follow the top economic events on FX Leaders economic calendar
- Trade better, discover more Forex Trading Strategies
- Open a FREE Trading Account


