Bitcoin Holds Above at $118K Despite First Major Bearish Signal in Weeks
Bitcoin (BTC) is still above $118,000 after its first major negative signal in weeks. The cryptocurrency has shown amazing strength despite
Quick overview
- Bitcoin remains above $118,000 despite recent selling pressure from miners and profit-taking by traders.
- Institutional buying and favorable regulatory developments are supporting a bullish outlook for Bitcoin's price.
- Technical analysis shows mixed signals, with a bearish pattern emerging but potential for a rise if Bitcoin stays above $112,000.
- Profit-taking among short-term holders is at record levels, but analysts predict Bitcoin could reach $150,000 in the coming weeks.
Bitcoin BTC/USD is still above $118,000 after its first major negative signal in weeks. The cryptocurrency has shown amazing strength despite miners selling more and others taking profits. The digital asset has stayed near its all-time highs, thanks to a lot of institutional buying and good news from regulators.
Institutional Accumulation Demonstrates Strong Underlying Demand
Even though there was a lot of selling pressure, institutional and retail investors have been very sure of themselves during the recent fall. Bitcoin’s cost basis distribution data shows that between the $116,000 and $118,000 price levels, buyers bought more than 196,600 BTC worth more than $23 billion. This strong buying demand shows that people still believe in Bitcoin’s long-term growth.
The way the market is building up signals that short-term traders may be taking profits, while long-term investors see these levels as good places to buy. This change makes a strong base for the following step in figuring out Bitcoin’s price.
Regulatory Tailwinds and ETF Inflows Support Bullish Outlook
Recent changes in the rules have been good for Bitcoin and are still helping it. The Trump administration’s support for cryptocurrencies has helped move forward important laws, such as the GENIUS stablecoin bill and the Digital Asset Market Clarity Act. Also, spot Bitcoin ETF inflows are at their highest levels in three months, which shows that institutions are interested again.
Bitcoin’s value is likely to keep going up because of clear rules and institutions using it. Market watchers say that the “global spot bid” is still robust thanks to Bitcoin ETFs, publicly traded corporations creating BTC treasuries, and other investments in infrastructure.
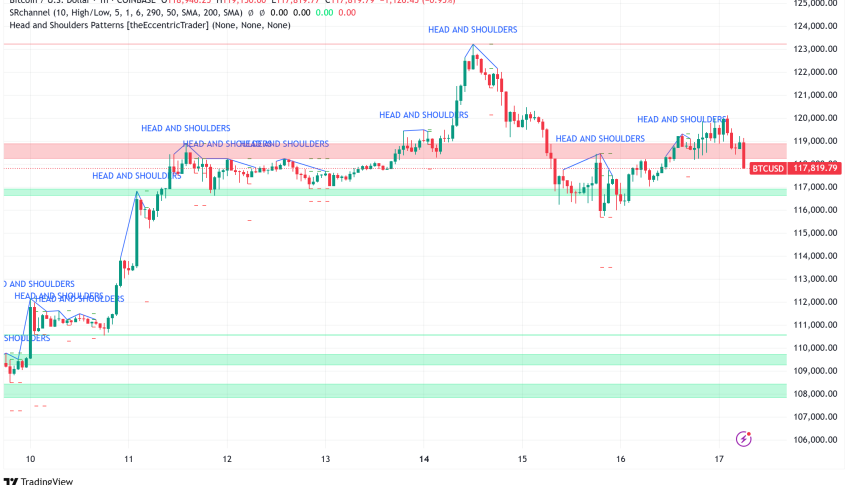
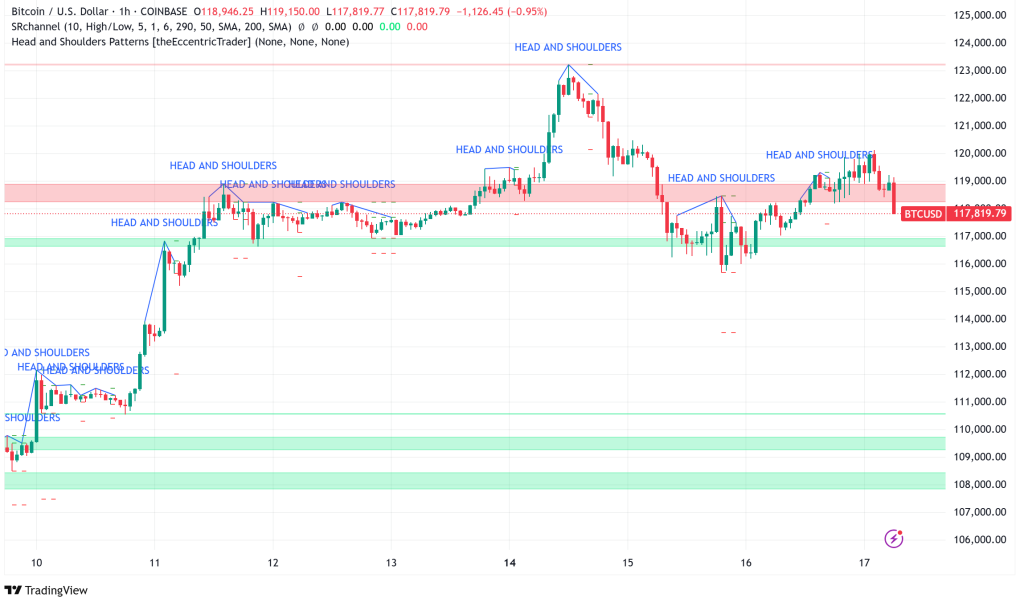
BTC/USD Technical Analysis: Mixed Signals Amid Consolidation Phase
The daily chart reveals that Bitcoin made a bearish engulfing candle pattern, which was reinforced by a shooting star formation. This was the first clear bearish indication since early May. This technical change comes after a strong 19% rise over the last 21 days, which could mean that the current uptrend is running out of steam in the short term.
Even though there are signs of concern, the cryptocurrency’s technical structure is still mostly optimistic. The chances of Bitcoin starting to rise again are high as long as it stays above the important $112,000 support level. The current drop looks like a healthy consolidation phase that lets the market cool off and get rid of too much leverage.
Bitcoin has verified an inverse head-and-shoulders pattern, which means it might reach $143,000. This bullish reversal pattern shows that if the price stays over $130,000 for a long time, it could start the next big move up toward $150,000.
Miner Selling Pressure Intensifies as Profit-Taking Reaches Record Levels
The Miners’ Position Index (MPI) has risen to 2.78, its highest level since November 2024, showing that Bitcoin miners are putting more and more pressure on the market. This indicator, which compares miners’ exchange deposits to their one-year average, shows that more selling is going on. The current number, on the other hand, is still much lower than what is usually seen at the tops of bull markets.
Along with this trend, the realized profit and loss from Bitcoin deposits to centralized exchanges reached an all-time high of $9.29 billion, which shows that people are aggressively taking profits. Short-term holders have been very active, with about 50,000 BTC sold at a loss in just 24 hours as people panicked after the price dropped.
Bitcoin Price Prediction: Path to $150K and Beyond
Several technical indications suggest what Bitcoin’s next big price objectives will be. The Short-Term Holder Cost Basis model says that $136,000 is the next important resistance level. This is the +2 standard deviation threshold that has traditionally marked areas where people take profits.
If Bitcoin breaks through $127,000 with confidence, the chances of it making a parabolic move toward $150,000 go up a lot. Some analysts think that if the current pace keeps up, it might reach $150,000 in the next few weeks. More aggressive goals could take it all the way to $250,000 by the end of the year.
Traders should still be careful, though, because things could change quickly. The Fear & Greed Index readings are quite high, and the open interest levels are getting close to “frothy” levels. This means that local declines of 10–20% are still likely as the market takes in recent gains.
- Check out our free forex signals
- Follow the top economic events on FX Leaders economic calendar
- Trade better, discover more Forex Trading Strategies
- Open a FREE Trading Account
- Read our latest reviews on: Avatrade, Exness, HFM and XM
Related Articles


Sidebar rates
Related Posts
