How To Trade Shooting Star Candlestick Patterns
Candlestick patterns remain a trusted tool for many traders, and the shooting star candlestick is a standout example.
When analyzing this pattern, it’s essential to differentiate between the bearish shooting star and its look-alike, the bullish inverted hammer. Although both patterns may seem similar at first glance, they send completely opposite signals.
The shooting star candle plays a crucial role in technical analysis by signaling a potential reversal in a bullish trend. Here are a few key points to consider:
- Bearish Reversal Indicator: Despite some misconceptions—like the term shooting star candlestick bullish—the shooting star actually indicates a bearish reversal. It suggests a potential loss of momentum in an uptrend and hints at an imminent downward price movement.
- Confirmation is Key: Relying solely on the shooting star candlestick pattern, or any single candlestick pattern, isn’t recommended. Seasoned traders often seek a confluence of different technical indicators and chart patterns to bolster their trading strategy.
- Risk Management: Understanding support and resistance levels, along with proper risk management, can significantly enhance your trading strategy when you trade the shooting star.
By considering these factors alongside other technical indicators, you’ll be better equipped to manage risk and capitalize on potential market reversals. Now, let’s dive into the specifics of the shooting star candlestick pattern and explore its application in trading strategies.
Introduction to the Shooting Star Pattern
The shooting star pattern is a bearish reversal candlestick pattern that typically appears at the top of an uptrend. It signals a potential shift in market sentiment by indicating that upward momentum may be waning and that sellers could be starting to take control.
Recognizing this shooting star candlestick is essential for traders who want to capitalize on potential market reversals. However, remember that using this pattern alongside other technical analysis tools—such as support and resistance levels or additional candlestick patterns—can help confirm the signal and lead to more informed trading decisions.
A few key points about the shooting star pattern include:
- Bearish Reversal Signal: The pattern indicates that a bullish trend might be nearing its end, suggesting a possible downward price movement.
- Confluence with Other Indicators: Relying solely on the shooting star candlestick pattern might result in false signals. Experienced traders combine this with other technical indicators and chart patterns to improve their trading strategies.
- Risk Management: Integrating risk management strategies is crucial when trading potential reversals, ensuring that you are prepared for any market scenario.
What Is A Candlestick Pattern?
Candlestick patterns are formed by the arrangement of individual candlesticks, each depicting the price movement of a security or asset over a chosen timeframe. For example, on a weekly chart, one candlestick represents the price action for an entire week. Each candlestick consists of two main parts:
- Body: Displays the opening and closing prices for the period.
- Wick (or Shadow): Highlights the range of prices reached during that timeframe.

Patterns such as the shooting star and the inverted hammer feature long upper shadows. These long upper wicks indicate the highest price levels reached during the trading session and provide valuable insight into market sentiment. The specific formation and position of a candlestick give traders either a bullish or bearish signal, forming the foundation of many technical analysis strategies.
Understanding these candlestick patterns, including the shooting star candlestick pattern, can significantly enhance your ability to navigate market trends and execute successful trades.
What Is A Shooting Star Candlestick Pattern?
The shooting star candlestick pattern is a bearish reversal signal that typically appears at the top of an uptrend, indicating it might be time to sell your position or open a short position. This pattern usually marks the end of the bullish phase and is a critical tool in technical analysis for spotting potential sell-offs. However, like all technical indicators, it comes with its advantages and disadvantages.
Here’s a quick breakdown of the shooting star candlestick pattern:
- Bearish Signal:
- Indicates potential reversal after an uptrend
- Often used as a cue to sell or short the asset
- Formation & Confirmation:
- Must form after a sustained uptrend
- Confirmation through subsequent price action is crucial, as a continued uptrend can invalidate the pattern
- Practical Considerations:
- In a shooting star stock pattern, if the price spikes and then forms a shooting star, traders might prepare to enter short positions—provided the pattern is confirmed
- The pattern’s effectiveness depends on its context and confirmation by other technical indicators or volume analysis
While the shooting star can be an effective signal for a potential sell-off, it isn’t foolproof. If the candlestick is followed by a continued uptrend, the reversal signal is negated, which is why confirmation through additional technical analysis is essential. Ultimately, the shooting star remains a valuable pattern in technical analysis, offering insights into market sentiment and potential reversals when used correctly.
How Does A Shooting Star Candlestick Pattern Look Like?
When analyzing a shooting star candlestick pattern, its color—red or green—is not the main focus. What truly matters is its structure. The key features to look for include:
- Long Upper Wick: The distance from the top of the wick to the opening price should be at least twice the size of the candle’s body.
- Small Body: The real body is short, emphasizing that the candle’s upper shadow dominates.
- Minimal Lower Wick: There should be little to no wick beneath the body, which further confirms the pattern’s formation.
These characteristics make the shooting star a vital bearish reversal pattern in technical analysis. Here are a few examples to illustrate how this pattern can appear:
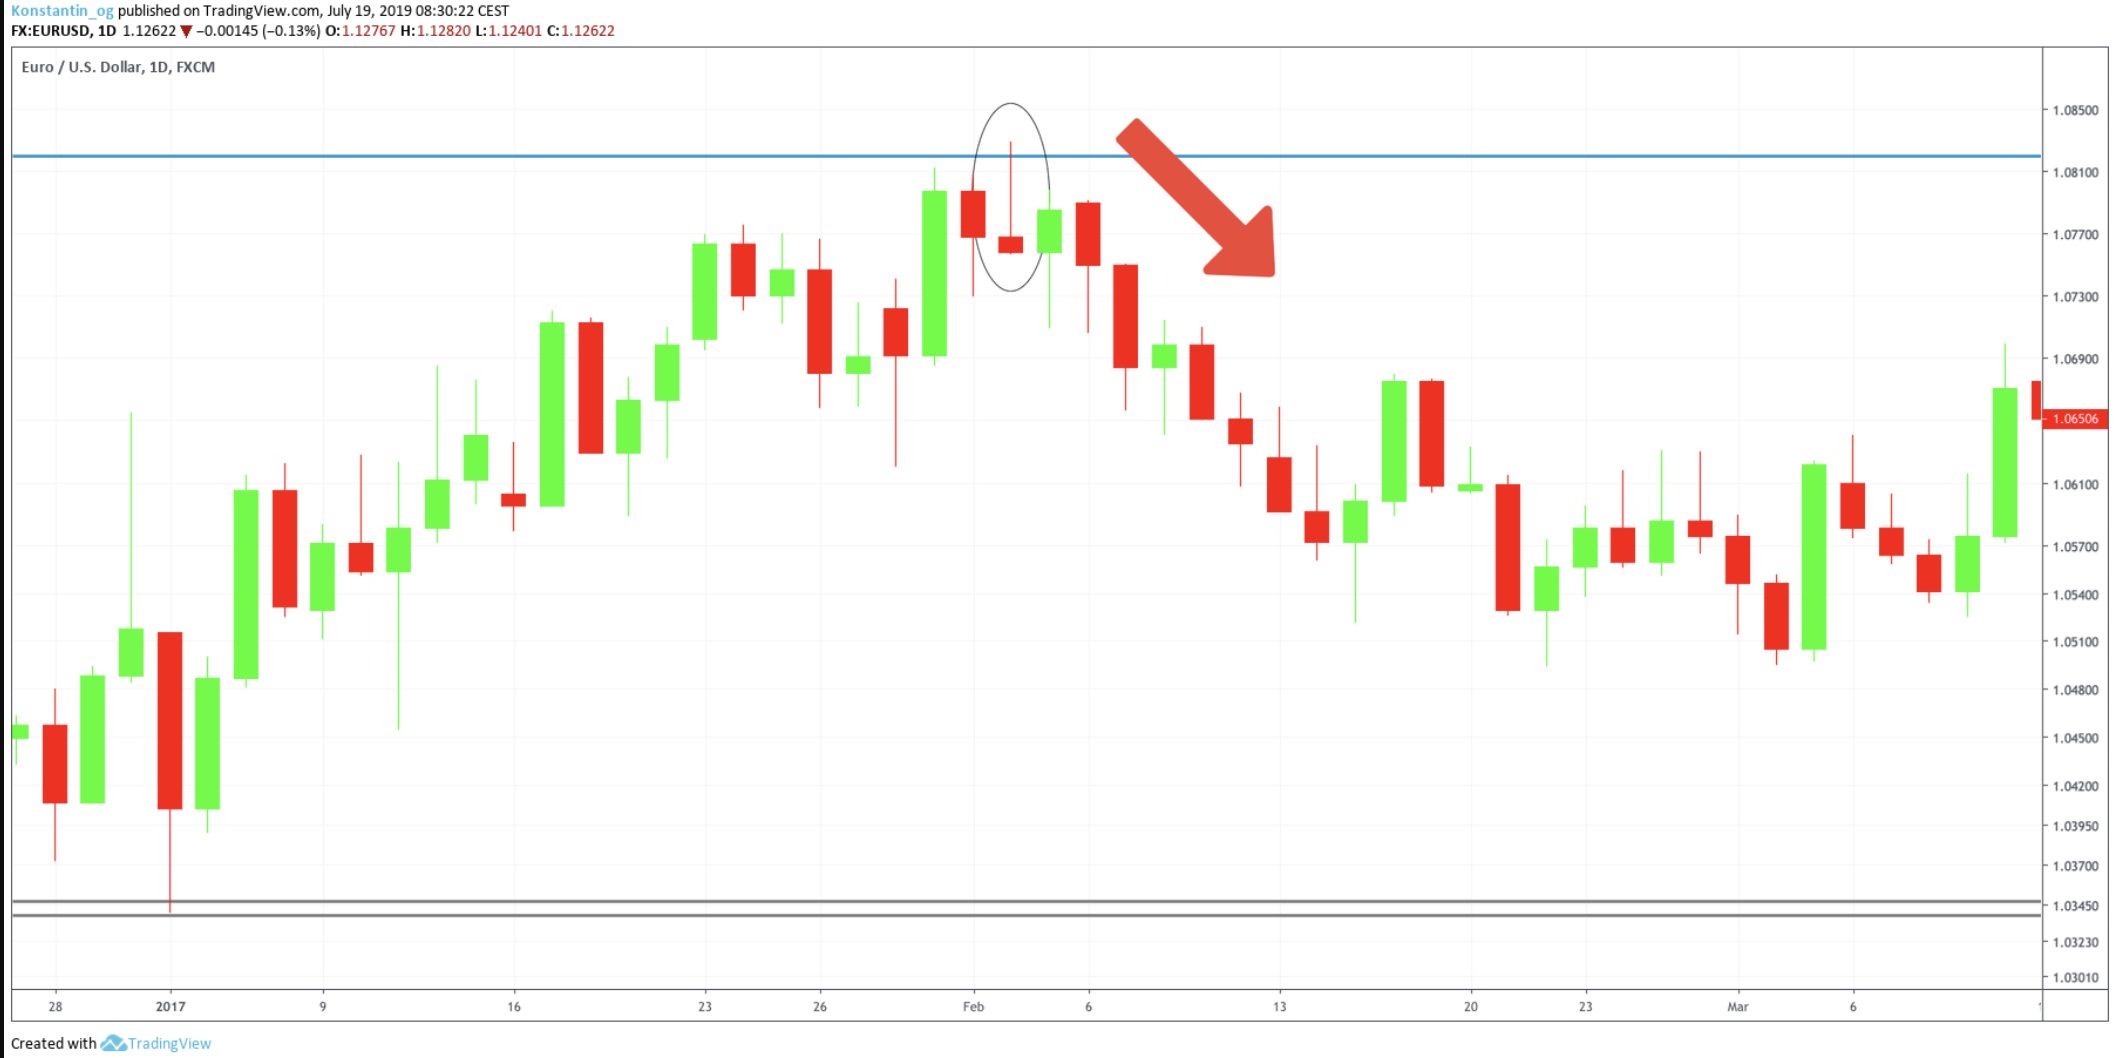
- Classic Example: A red shooting star appears during a strong uptrend, followed by a green candle. Although the green candle might seem to invalidate the reversal, it can sometimes be a false signal, with the market quickly reversing into a steep decline.
- Green Shooting Star: Even when the candle is green, the pattern remains significant. After an extended uptrend, a green shooting star—with a long upper wick and nearly no lower wick—can also signal that sellers are beginning to dominate, potentially leading to a sharp downturn.
- Reversal Attempt in a Downtrend: Sometimes, a shooting star forms after a brief upward movement during a downtrend. Despite the attempted reversal, the pattern indicates that the upward momentum was insufficient, and the downtrend is likely to continue.
A typical shooting star candlestick pattern which formed a red shooting star which was followed by a green candle. The green candle was a false invalidation signal and was quickly followed by a steep decrease in price.
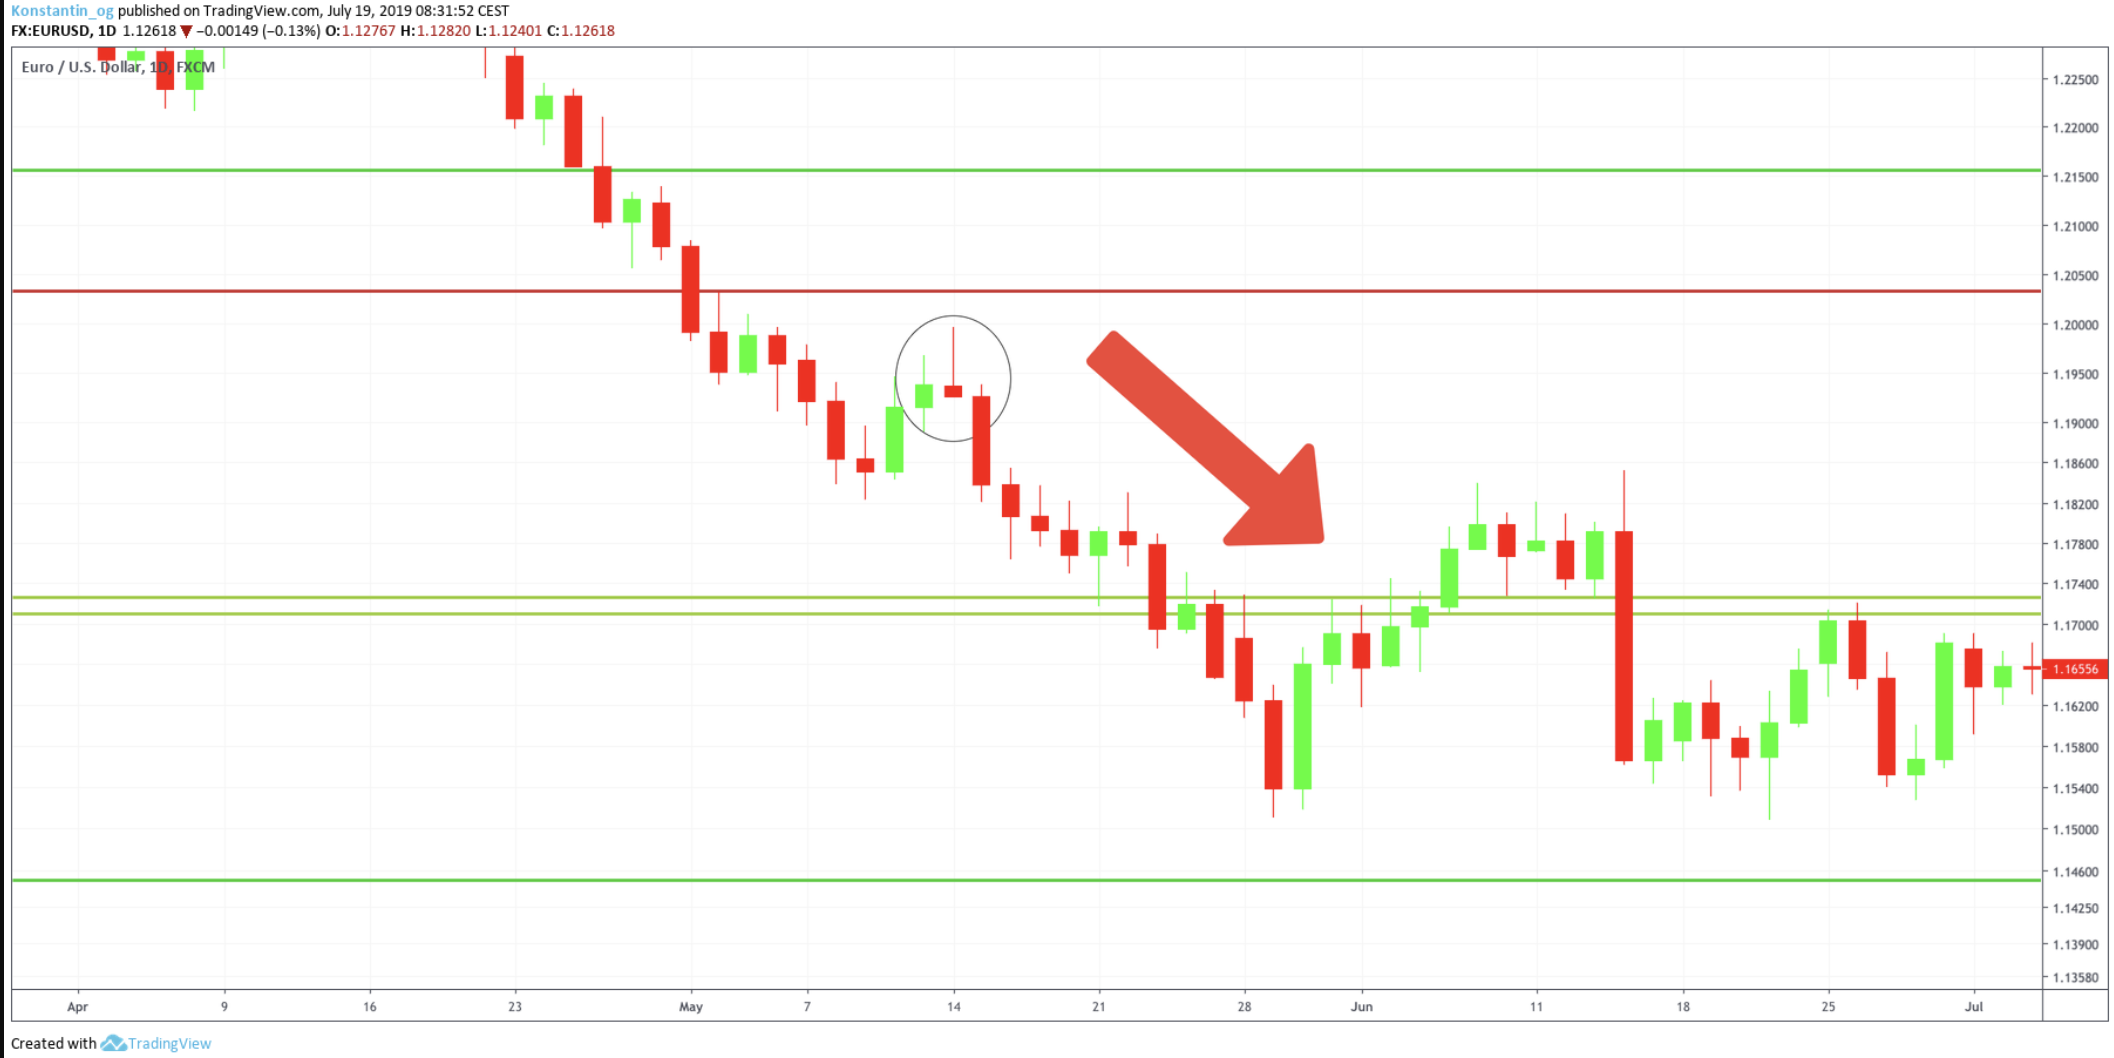
A perfect example of a shooting star, although the candle is green. As you can see, it appeared after a strong uptrend and was directly followed by a harsh downturn movement. The wick is long and to the upside, while the body is short and there is almost no wick underneath the shooting star’s body.
Another great example of how a shooting star candlestick pattern can look like: It can also appear after a downtrend tries to reverse the trend by upward movements. However, the reversal failed as the shooting star candlestick initiated a continuation of the downtrend.
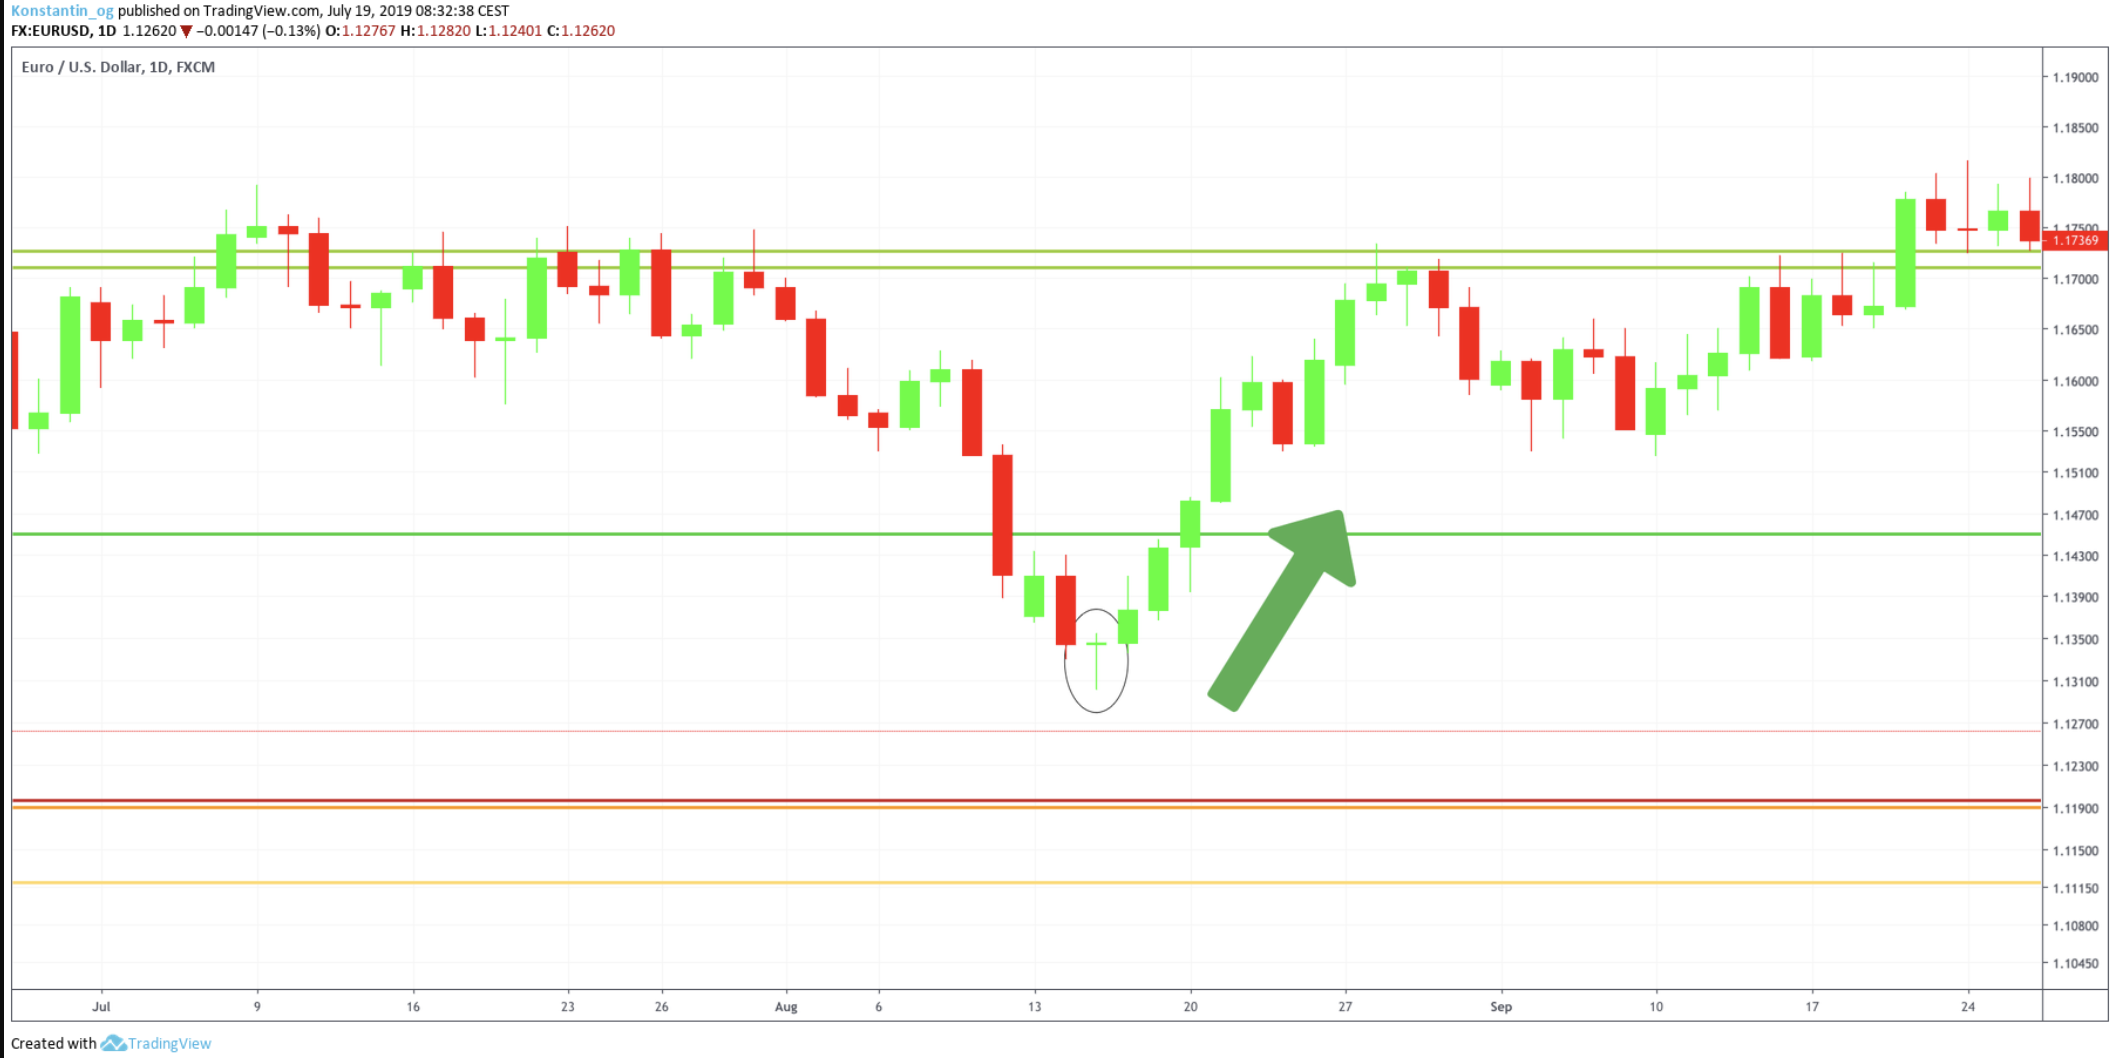
It is important to differentiate between the bearish shooting star pattern and the bullish inverted hammer pattern. Both show the same candlestick formation; however, the position is different. In fact, the bullish inverted hammer candlestick pattern indicates an uptrend and is often followed by a bullish hammer-like candlestick formation.
As seen in the chart, both inverted hammer candlestick patterns resulted in a heavy upward movement.
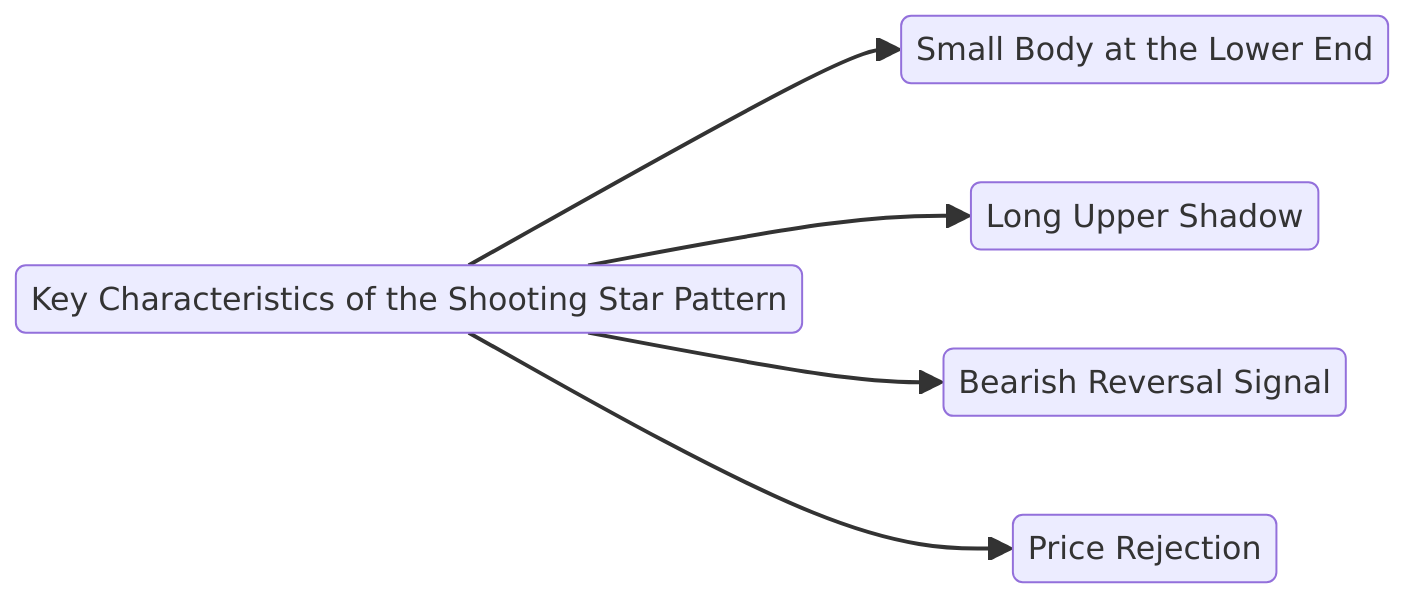
Key Characteristics of the Shooting Star Pattern
The shooting star pattern stands out from other candlestick formations thanks to its distinctive features. Here’s what you need to know:
- Small Body at the Lower End: The candle’s body is short and located near the bottom of the price range, indicating that buyers initially pushed the price upward.
- Long Upper Shadow: A prominent upper wick shows that prices were driven significantly higher during the session but then retreated, closing near the opening price.
- Bearish Reversal Signal: Despite sometimes appearing in green—as in the case of a green shooting star candlestick—the pattern is inherently bearish. It signals that sellers have started to regain control, potentially marking a shift from an uptrend to a downward movement.
- Price Rejection: The long upper shadow is a clear indicator of price rejection at higher levels, emphasizing that the bullish momentum was short-lived.
Whether you’re analyzing a classic red shooting star or a green variant, the key takeaway is that the pattern points to a potential reversal. By integrating this insight with other technical analysis tools and risk management strategies, you can better navigate market trends and refine your trading strategy.
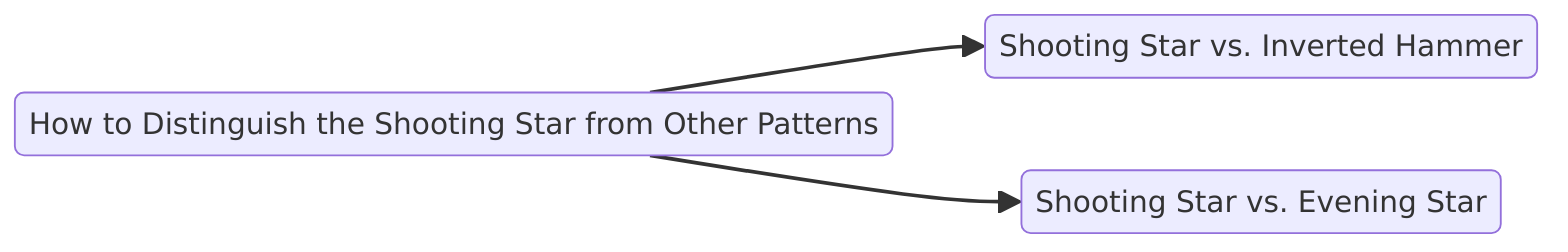
How to Distinguish the Shooting Star from Other Patterns
The shooting star pattern can be easily confused with other candlestick formations like the inverted hammer and the evening star, but each has its own unique characteristics:
- Shooting Star vs. Inverted Hammer:
- Shooting Star: A bearish reversal pattern that appears at the top of an uptrend. It features a small body at the lower end with a long upper shadow, indicating that prices were pushed high during the session but then retreated, suggesting a potential downward reversal.
- Inverted Hammer: A bullish reversal pattern that occurs at the bottom of a downtrend. Although it looks similar—with a small body and a long upper shadow—it signals that buyers may be stepping in to reverse the downward movement.
- Shooting Star vs. Evening Star:
- Shooting Star: This is a single-candle pattern that clearly marks the potential end of an uptrend by showing a clear rejection of higher prices.
- Evening Star: In contrast, the evening star is a multi-candle pattern consisting of three candles—a large bullish candle, followed by a small-bodied candle, and then a large bearish candle. This sequence collectively indicates a shift from an uptrend to a downtrend.
Understanding these distinctions is key to avoiding misinterpretation. Whether you’re trading the shooting star candlestick or comparing it to similar patterns, knowing these nuances helps you integrate technical indicators and manage risk effectively.
Limitations Of Candlestick Analysis
While candlestick patterns, like the shooting star, can offer valuable insights into market sentiment, it’s important to recognize their limitations. Relying on a single candle may not provide a comprehensive picture of the market dynamics. Here are a few points to consider:
- Timeframe Matters: The significance of a candlestick pattern increases with the timeframe. For instance, a shooting star on a weekly chart is generally more meaningful—and more bearish—than one on a 4-hour chart.
- Need for Confirmation: A solitary shooting star or any single candlestick pattern should not be the sole basis for a trading decision. Integrating additional technical indicators and patterns can help confirm the signal and reduce the risk of false interpretations.
Confluence Of Technical Indicators
Experienced traders know that the best setups often come from a confluence of multiple technical indicators pointing in the same direction. In practice, this means:
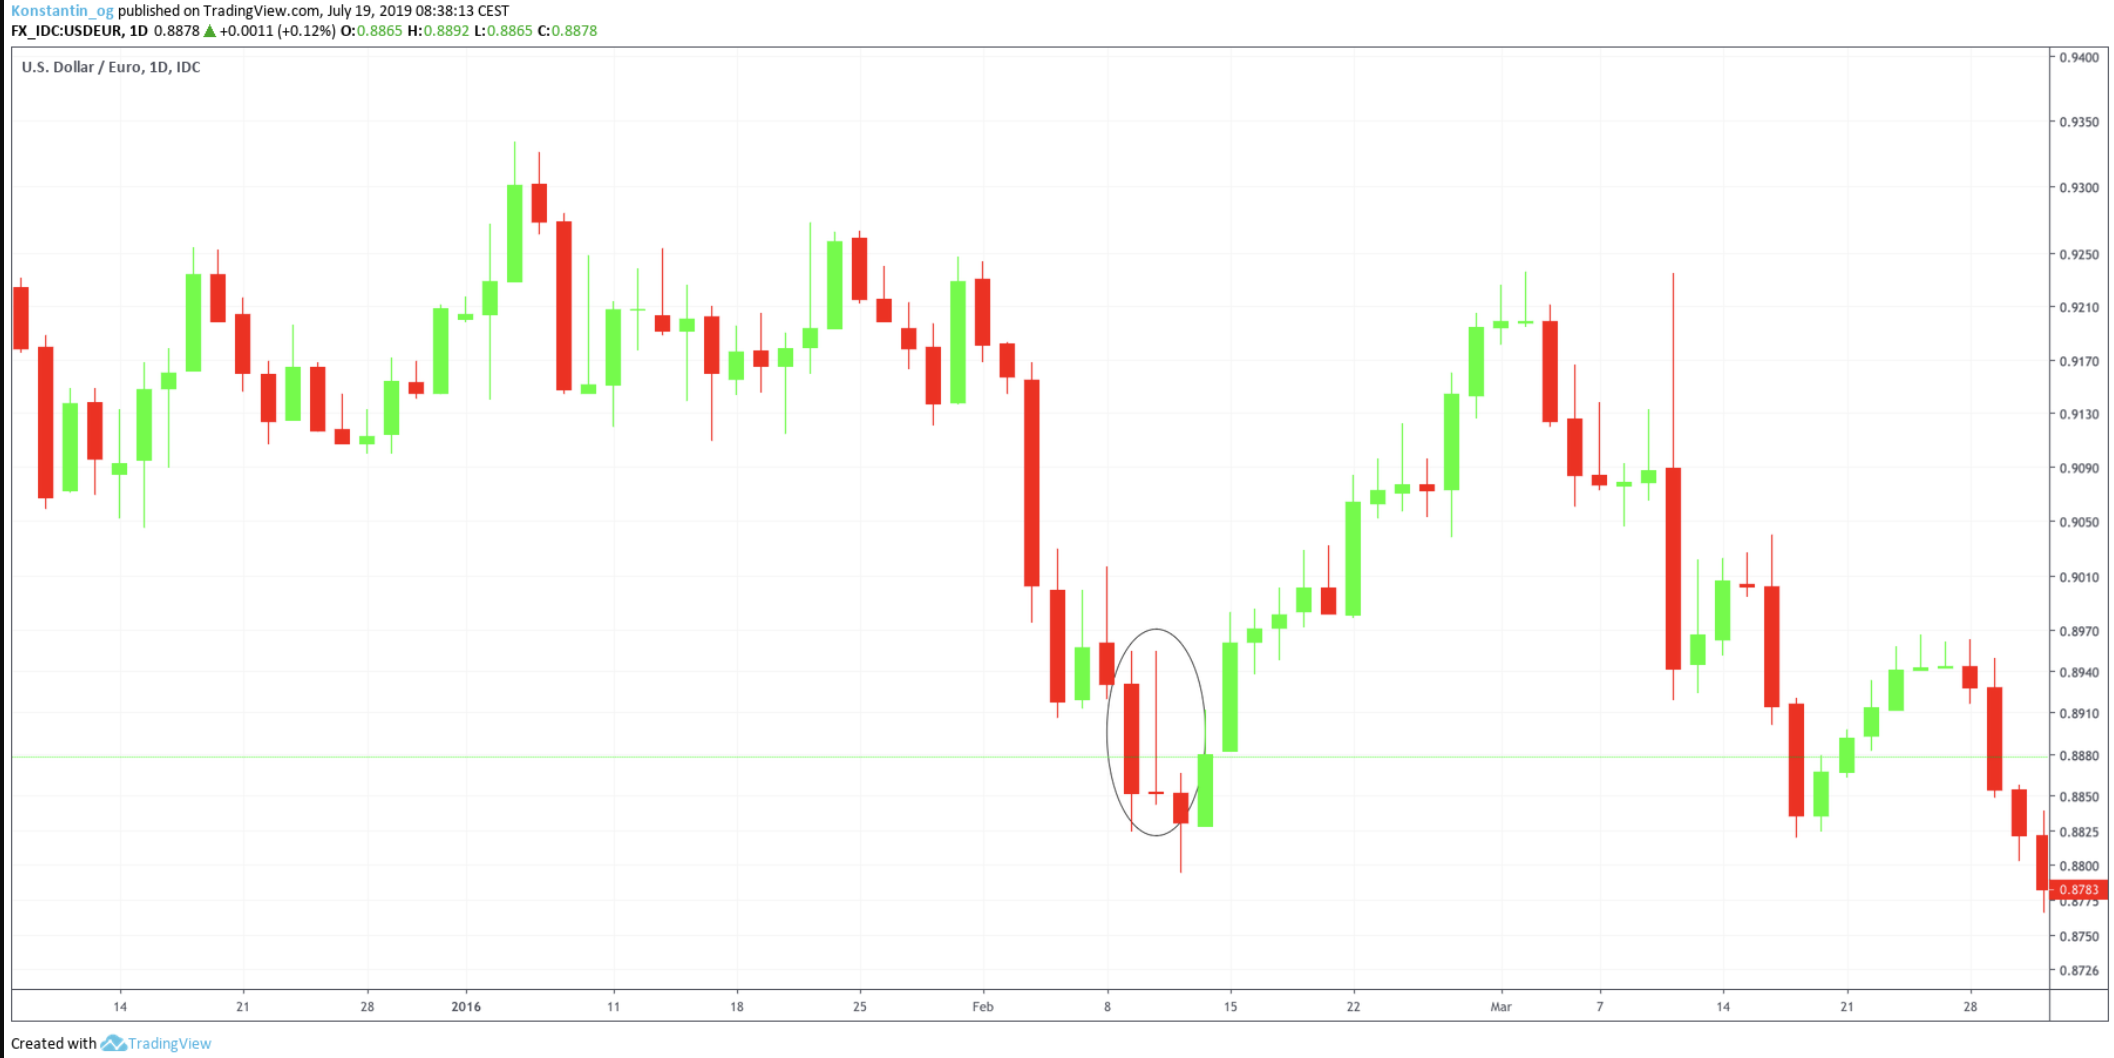
- Multiple Confirmations: In both examples, the shooting star candlestick pattern forms around the 0.8832 price level, coinciding with a well-defined resistance zone highlighted in red. This resistance had previously acted as a barrier, making the bearish reversal signal from the shooting star even more credible.
- Timing Matters: Notice how the shooting star is confirmed by the next candlestick closing lower, indicating that sellers have taken control. This confirmation reduces the likelihood of false signals. The price sharply declines from 0.8832 down to around 0.8600, marking a significant bearish move after the pattern formed.
- Combining Tools: Consider other indicators like the RSI and MACD for additional confirmation.
- RSI (Relative Strength Index): In the first chart, the RSI is above 70, signaling overbought conditions. This suggests that the asset was overextended, increasing the probability of a bearish reversal.
- MACD (Moving Average Convergence Divergence): The MACD lines are peaking and show a bearish crossover shortly after the shooting star forms, further confirming weakening bullish momentum.
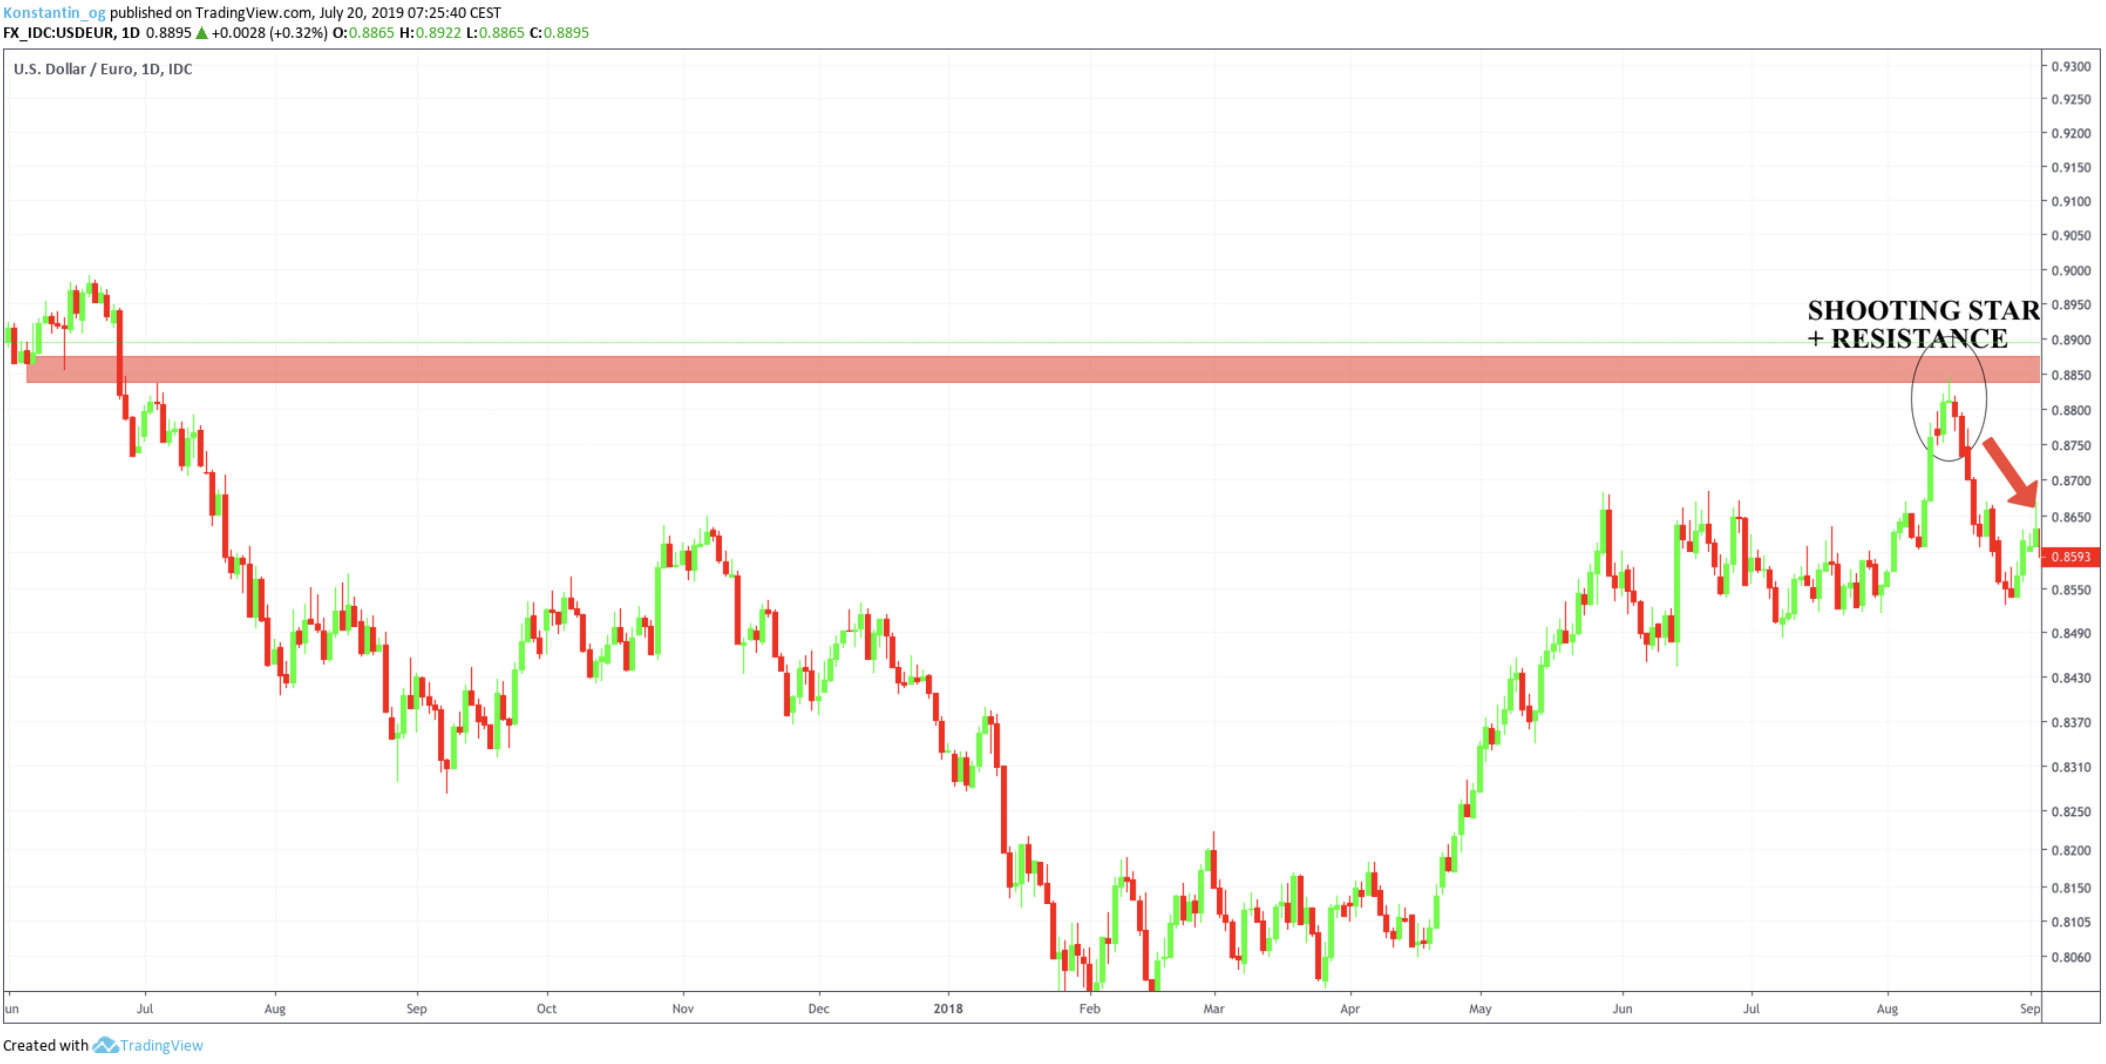
Chart 1 (U.S. Dollar/Euro, 1D Timeframe):
- Shooting Star Formation: Around 15 August 2018, price hits 0.8832 at the resistance zone.
- RSI Reading: Close to 75, indicating overbought conditions.
- MACD: Bearish divergence appears as the MACD histogram starts declining while the price reaches new highs.
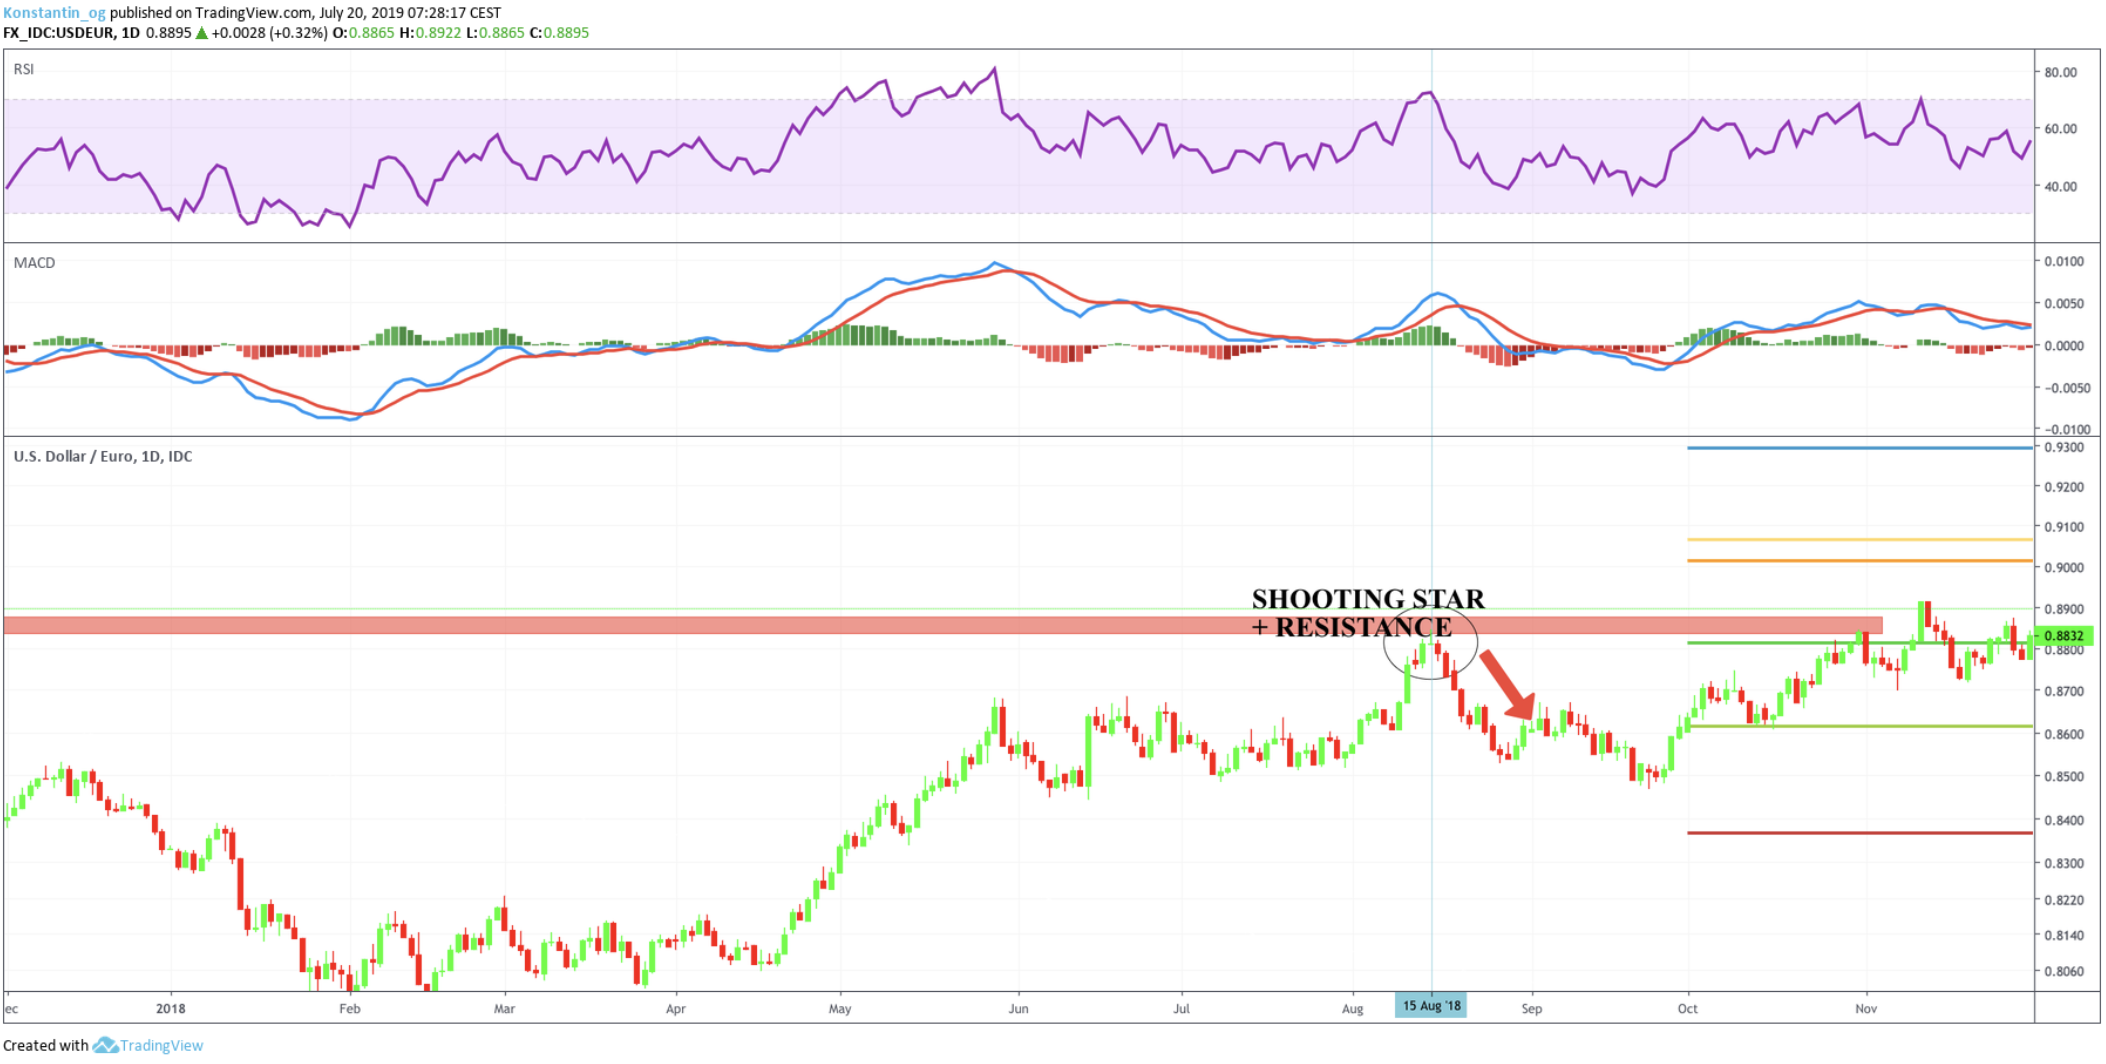
By integrating these multiple confirmations, you can better manage risk and improve your overall trading strategy.
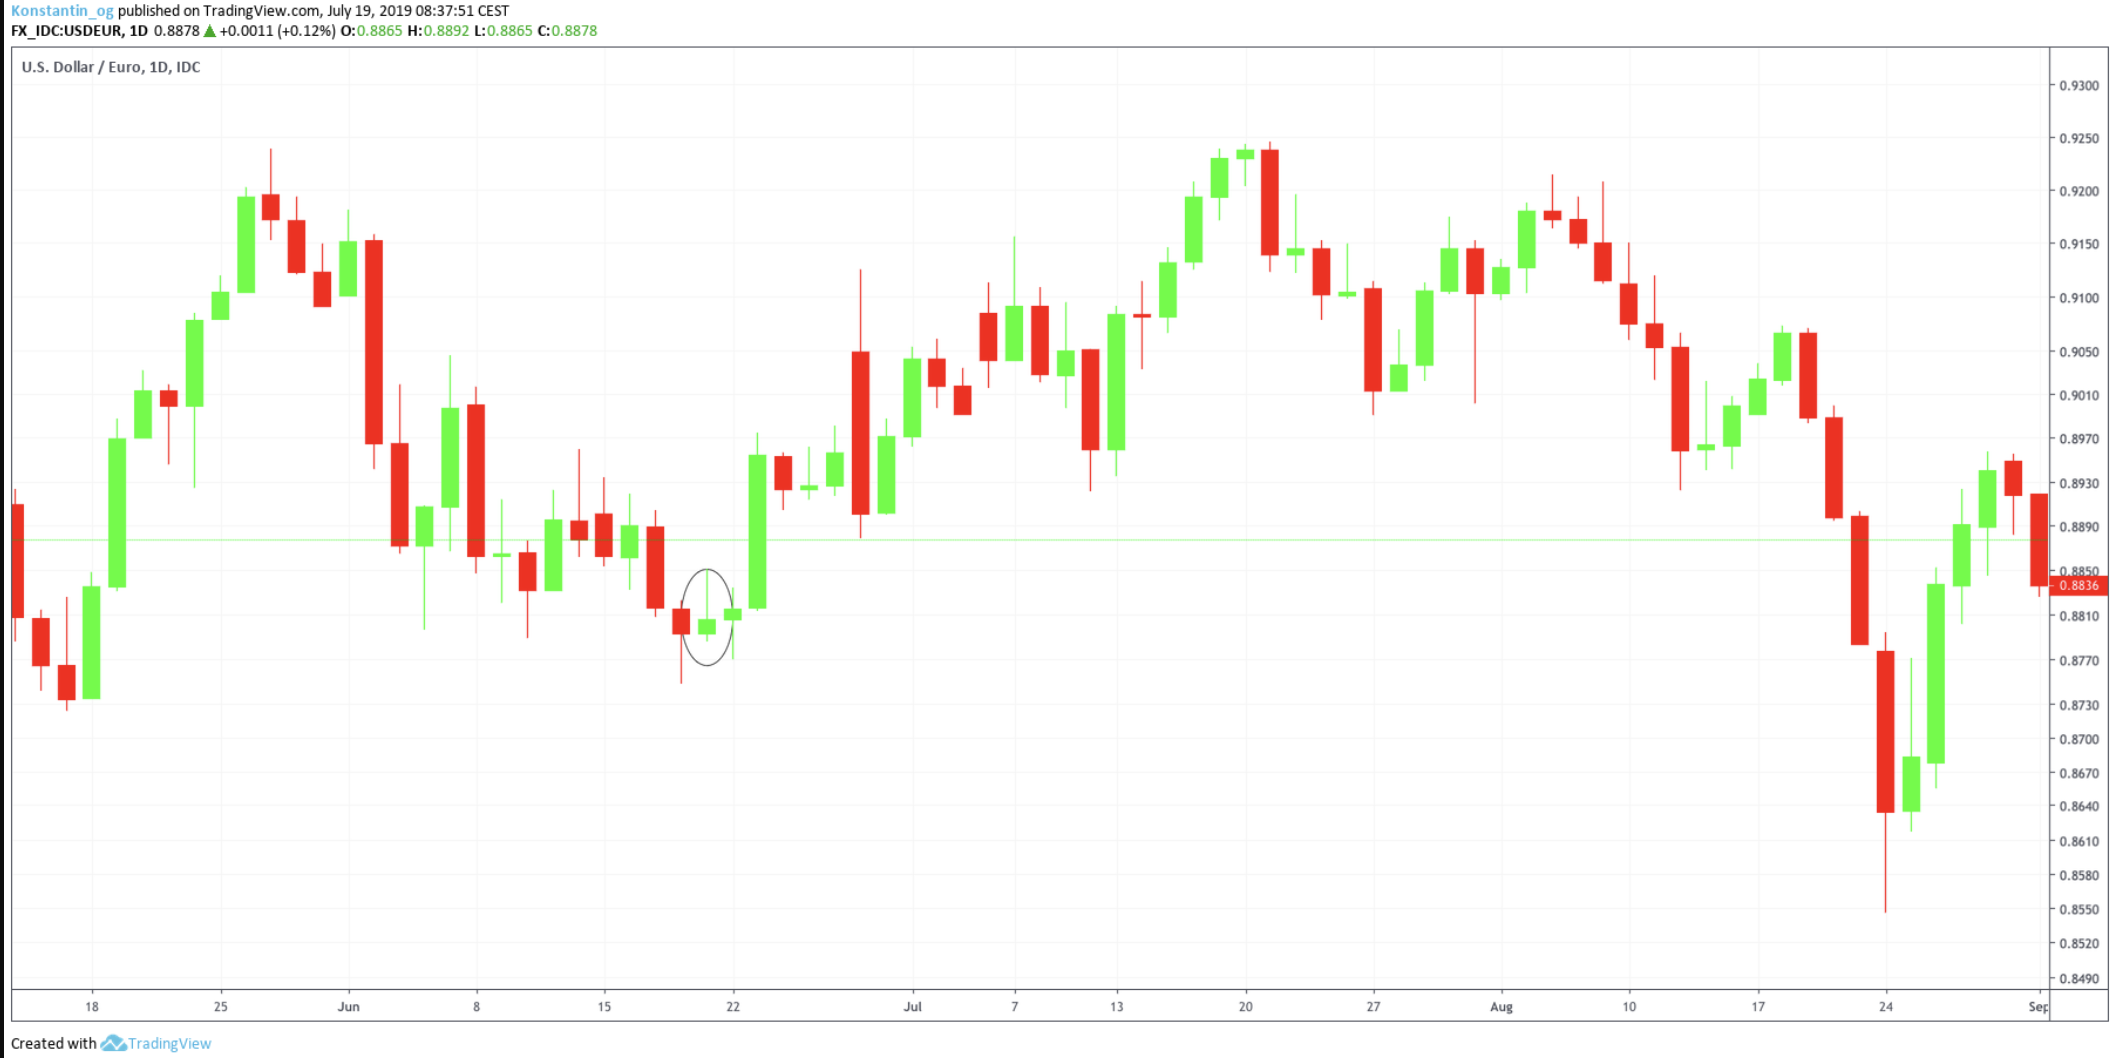
- Shooting Star Formation: Occurs just below 0.8850, again within a strong resistance zone.
- Price Reaction: After the shooting star forms, the price drops sharply to around 0.8593, confirming the bearish reversal.
- RSI: Stays above 70, suggesting potential exhaustion in the uptrend.
Why This Trade Setup Was Strong
This would have been an ideal trade because:
- The shooting star pattern formed at a key resistance area.
- The RSI was in the overbought zone, confirming stretched bullish momentum.
- The MACD showed weakening momentum with a bearish crossover.
The price drop from 0.8832 to around 0.8600 represents a substantial move, demonstrating how the confluence of technical indicators—price action, resistance levels, RSI, and MACD—can significantly increase the probability of a successful trade.
By integrating such confirmations, traders can better manage risk and execute more precise trades, capitalizing on potential trend reversals.
Best Practices for Trading the Shooting Star
Trading the shooting star pattern effectively involves a structured approach that combines technical signals with sound risk management. Here’s a step-by-step guide to using this pattern in your trading strategy:
- Identify the Pattern at the Top of an Uptrend:
Recognize the shooting star candlestick formation—small body at the lower end with a long upper shadow—occurring after an extended uptrend. This setup suggests that sellers may be gaining control. - Wait for Confirmation:
Don’t rush into a trade immediately. Allow the next candlestick to close lower to confirm that the bearish reversal is genuine. This helps filter out false signals. - Analyze the Volume:
Look for higher trading volume during the formation of the shooting star. Increased volume can reinforce the bearish signal by showing stronger selling pressure. - Enter the Trade with a Sell Order:
Once confirmed, place a sell order. Use the shooting star’s high as a reference point to set your stop-loss order. This minimizes risk if the market moves against your position. - Set Profit Targets:
Determine your exit strategy by identifying key support levels or using a predetermined risk-reward ratio. This ensures that you lock in gains while managing potential losses.
Whether you’re using other technical indicators like RSI or MACD for further confirmation, or simply integrating strong risk management practices, this methodical approach enhances your ability to make informed trading decisions.

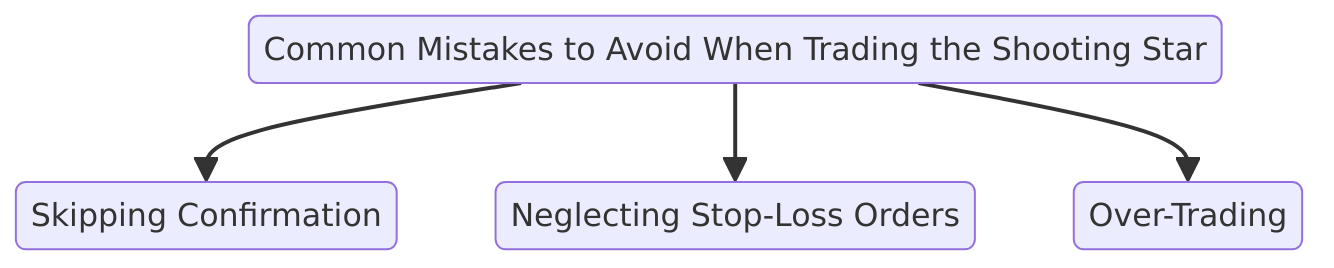
Common Mistakes to Avoid When Trading the Shooting Star
To increase your chances of success when trading the shooting star pattern, it’s important to steer clear of several common pitfalls:
- Skipping Confirmation:
Relying solely on the shooting star without confirming the signal with other technical analysis tools—such as RSI, MACD, or key support/resistance levels—can lead to false signals, especially in a strong uptrend. Always wait for multiple confirmations before making a trade. - Neglecting Stop-Loss Orders:
Failing to set a stop-loss order can expose you to significant losses if the market doesn’t move in the anticipated direction. Use the shooting star’s high as a reference point for your stop-loss to effectively manage risk. - Over-Trading:
Impulsive decisions driven by over-trading can quickly derail your strategy. Stick to your trading plan and avoid taking trades that don’t meet your predefined criteria.
By being mindful of these common mistakes and maintaining a disciplined approach, you can better harness the shooting star candlestick pattern as part of a broader, well-rounded trading strategy.
Confirmation & Stop-Loss
Even with confirmation, there’s no guarantee that the price will continue to fall or by how much. The shooting star candlestick pattern doesn’t provide a specific price target; it merely suggests that a decline may be coming. In some cases, despite a bearish shooting star signal, the price might continue rising as part of a longer-term uptrend.
To trade the shooting star pattern effectively, consider these key points:
- Confirm with Market Action and Volume: Validate the bearish signal by observing subsequent price behavior and analyzing trading volume. Higher volume during the shooting star formation can reinforce the likelihood of a reversal.
- Use Stop-Loss Orders: Since the pattern doesn’t indicate how far the price will move, placing a stop-loss order is essential. This risk management tool helps protect your position if the market doesn’t move as expected.
Conclusion
In summary, the shooting star candlestick pattern is a powerful tool in technical analysis, signaling potential bearish reversals at the top of uptrends. However, its effectiveness relies on proper identification, confirmation with additional technical indicators, and rigorous risk management practices.
By understanding its key characteristics, differentiating it from similar patterns like the inverted hammer and evening star, and employing best practices such as waiting for confirmation and setting stop-loss orders, traders can integrate the shooting star pattern into a robust trading strategy.
Remember, while this pattern indicates a possible shift in market sentiment, it does not provide precise price targets—making confirmation and risk management essential for successful trading.
FAQ Section
- What exactly is a shooting star candlestick pattern?
The shooting star is a single-candle bearish reversal pattern that appears at the top of an uptrend. It is characterized by a small real body near the lower end, a long upper shadow, and little to no lower wick. This formation suggests that despite a brief period of bullish momentum, sellers are taking control, potentially leading to a price decline. - How do I confirm a shooting star signal before entering a trade?
Confirmation is crucial when trading the shooting star. You can verify the pattern’s signal by waiting for the next candlestick to close lower, analyzing trading volume for additional bearish pressure, and looking for confluence with other technical indicators like resistance levels, RSI, or MACD. These confirmations help reduce the risk of false signals. - Can the shooting star pattern be used on all timeframes?
Yes, the shooting star pattern can appear on any timeframe; however, its significance increases on higher timeframes. For instance, a shooting star on a weekly chart tends to carry more weight—and may indicate a more serious bearish reversal—than one on a 4-hour chart. Always consider the timeframe in your analysis to ensure proper context. - What are the best practices for managing risk when trading the shooting star?
Managing risk is essential when trading any candlestick pattern. With the shooting star, always set a stop-loss order above the candle’s high to protect against unexpected price moves. Additionally, avoid over-trading and ensure that the pattern is confirmed by other indicators before taking a position. This disciplined approach can help mitigate potential losses if the price continues to rise as part of a longer-term uptrend. - How can I integrate the shooting star into my overall trading strategy?
Integrating the shooting star into your trading strategy involves a few key steps:- Identification: Recognize the shooting star at the top of an uptrend.
- Confirmation: Wait for the next candlestick to close lower and look for supporting signals from volume or other technical tools.
- Risk Management: Set your stop-loss above the shooting star’s high and define clear profit targets based on support levels or a risk-reward ratio.
- Confluence: Combine this pattern with other analysis methods, such as RSI overbought conditions or MACD peaks, to strengthen your trade decision.
By following these guidelines, you can use the shooting star pattern to enhance your technical analysis and improve your overall trading strategy.
Sidebar rates
