Gold Price Slides to $3,328 as Dollar Gains and Triangle Squeeze Tightens
Gold fell to $3,328 on Thursday as the US dollar rebounded and market jitters eased after President Trump downplayed...
Quick overview
- Gold prices fell to $3,328 as the US dollar strengthened and market concerns eased following President Trump's comments on Fed Chair Jerome Powell's job security.
- The US PPI report showed flat growth, reducing inflation concerns and limiting gold's upside potential.
- Gold is currently forming a symmetrical triangle pattern, indicating a potential breakout in either direction as it approaches key resistance and support levels.
- Traders should monitor the RSI and volume for confirmation of the breakout direction, as the market remains in a wait-and-see phase.
Gold fell to $3,328 on Thursday as the US dollar rebounded and market jitters eased after President Trump downplayed concerns about Fed Chair Jerome Powell’s job. The US dollar index rose 0.4% making gold less attractive for non-dollar holders as bullion is priced in USD.
Trump said it was “highly unlikely” he would fire Powell, reducing the political uncertainty that had supported gold earlier in the week. He left the door open for criticism but that reduced speculation of near term Fed disruption.
Meanwhile June’s US PPI was flat, defying expectations. The report showed rising goods prices due to tariffs were offset by falling service prices. That reduced inflation concerns and took the urgency out of the Fed’s hands – again limiting gold’s upside.
EU trade commissioner Maros Sefcovic was in Washington for tariff talks and offered a more diplomatic tone in global trade which has for now cooled safe-haven demand.
Gold Technicals: Symmetrical Triangle Compression
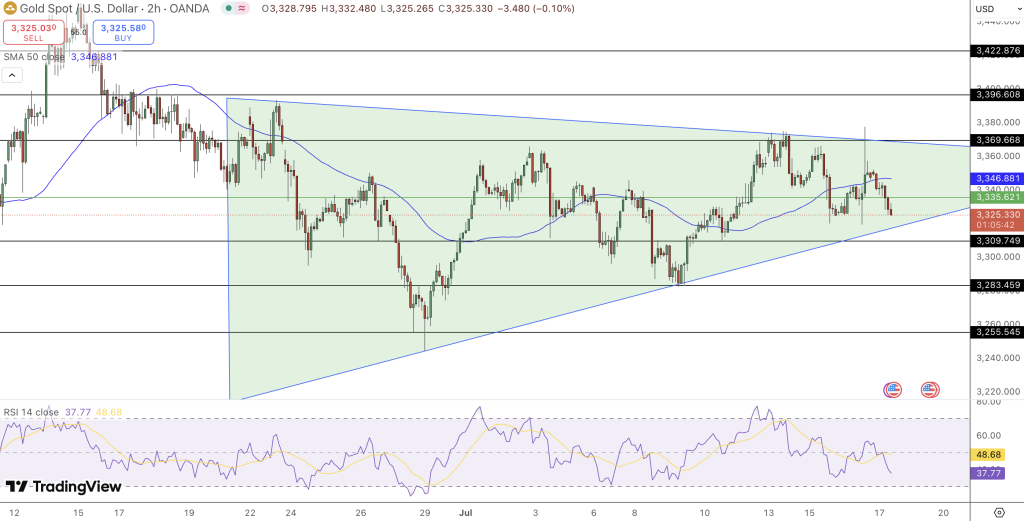
Gold (XAU/USD) is coiling in a textbook symmetrical triangle on the 2 hour chart – a formation created by converging trendlines of higher lows and lower highs. This type of price action means a pause before a break out in either direction.
The 50 period Simple Moving Average (SMA) at $3,346 is acting as resistance. Gold has failed to break above it multiple times. On the downside support is building at the rising trendline from June 26 at $3,309. That’s where the lower boundary of the triangle meets the minor horizontal support.
The longer gold stays in this formation the more explosive the eventual break out will be.
Momentum Fades as RSI Dips Below 40
The Relative Strength Index (RSI) – a momentum indicator – has dropped to 39.70. Not oversold yet but below 40 is often seen as bearish momentum.
More importantly RSI has failed to break above 50 on recent rallies. That’s reflective of weak bullish follow through and aligns with price action stalling at resistance.Unless RSI starts to rise and price breaks above the $3,369 triangle top the momentum outlook is bearish. But a sudden RSI pop above 50 could flip sentiment and signal a bullish break out.
Key Levels Gold Traders Are Watching
- Immediate Resistance: $3,346 (SMA), $3,369 (triangle top)
- Support Zones: $3,309 (trendline), $3,283 (swing low), $3,255 (deeper floor)
- Breakout Targets: Up to $3,396 and $3,422; down to $3,283 or $3,255
Final Takeaway
Gold is in a narrowing range but not for long. Symmetrical triangles don’t last forever. Traders should be prepared for a big break – either up to $3,400+ or down to $3,200s. Watch the RSI, trendline breaks and volume spikes for confirmation. Until then this is a wait-and-see setup.
- Check out our free forex signals
- Follow the top economic events on FX Leaders economic calendar
- Trade better, discover more Forex Trading Strategies
- Open a FREE Trading Account
- Read our latest reviews on: Avatrade, Exness, HFM and XM
Related Articles


Sidebar rates
Related Posts
