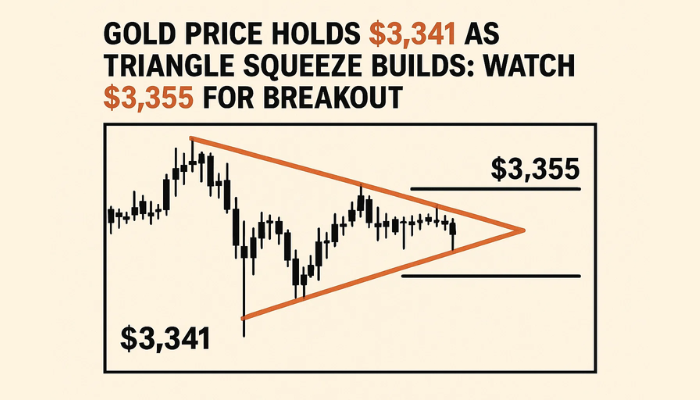
Gold Price Holds $3,341 as Triangle Squeeze Builds: Watch $3,355 for Breakout
Gold held steady at $3,341 on Thursday as a strong US dollar capped gains despite growing expectations of a breakout.
Quick overview
- Gold prices remained steady at $3,341, constrained by a strong US dollar and cautious market sentiment.
- Spot gold experienced a slight decline of 0.1% for the week, while platinum reached a 10-year high.
- Technical analysis shows gold coiling within a symmetrical triangle, indicating potential for high volatility ahead.
- Key levels to watch include resistance at $3,355 and support at $3,335, with the next move likely to be significant.
Gold held steady at $3,341 on Thursday as a strong US dollar capped gains despite growing expectations of a breakout. Traders sat on the sidelines ahead of more data and potential Fed comments.
According to Reuters, spot gold fell 0.1% for the week, while platinum hit a 10-year high. The overall market mood is cautious with the US dollar index firm, reducing gold’s appeal to foreign buyers.
Fed expectations are all over the place and with Treasury yields steady, gold is stuck in a tug of war between rate cut hopes and macro headwinds. But from a technical perspective, things are getting tighter.
Price Coils in Triangle: $3,355 Is the First Test
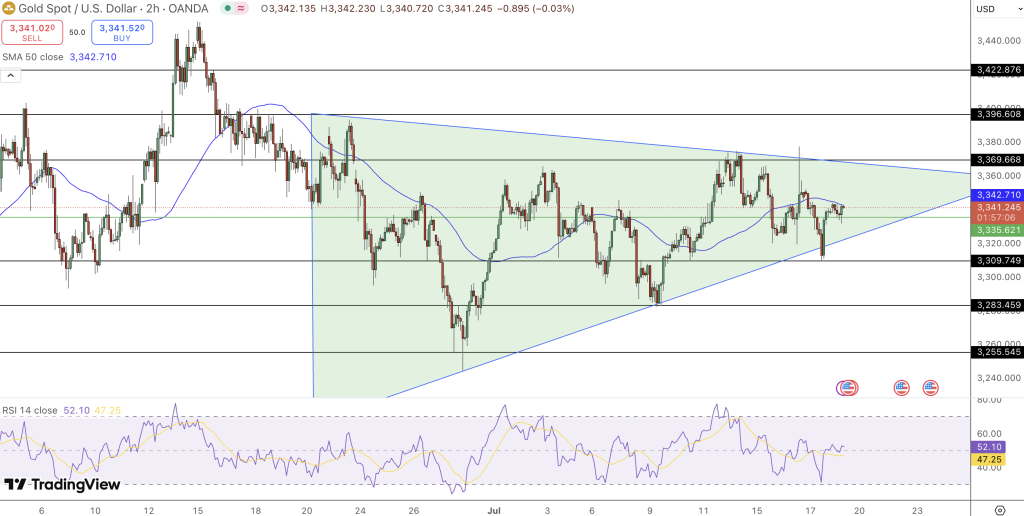
On the chart, gold (XAU/USD) is coiling inside a symmetrical triangle with the apex getting closer. These patterns precede high volatility moves.
Here’s what to watch:
- Current price: $3,341.25
- First resistance: $3,342.71 (SMA 50), then $3,350-$3,355
- Breakout target (bullish): $3,370, $3,396
- Support: $3,335.62, $3,309.74, $3,283.46
- RSI: 52.10 – slightly bullish, neutral zone
The 50-period SMA is above current price and has been acting as dynamic resistance. Gold has printed higher lows since early July, so the ascending support line of the triangle is intact.
RSI above 50 shows bullish momentum is building but no breakout yet.
Trade Levels: Breakout or Breakdown?
With the triangle range getting narrower, the next move could be big. But instead of jumping the gun, wait for confirmation.
Bullish Case:
- Above $3,355 opens up $3,370
- Volume supported close above SMA 50 confirms
- RSI heading to 60 means momentum is growing
Bearish Case:
- Below $3,335 is weakness
- Targets $3,309, then $3,283
- RSI under 50 + bearish volume = downside confirmation
Final Take: Setup is mature, direction isn’tGold is coiling and momentum is growing. Above $3,355 opens up $3,370, below $3,335 flips the structure.
- Check out our free forex signals
- Follow the top economic events on FX Leaders economic calendar
- Trade better, discover more Forex Trading Strategies
- Open a FREE Trading Account
- Read our latest reviews on: Avatrade, Exness, HFM and XM
Related Articles


Sidebar rates
Related Posts
