WTI Crude Climbs to $67.90 as RSI Hits 66—Can Oil Break Through $68.81?
WTI crude oil went above $67.90 on Thursday as bulls reacted to a bigger than expected draw in US commercial inventories.
Quick overview
- WTI crude oil prices rose above $67.90 following a larger than expected draw in US commercial inventories, with a reported decline of 3.9 million barrels.
- OPEC+ is increasing global supply, while strong US fuel consumption during the summer travel season is boosting demand.
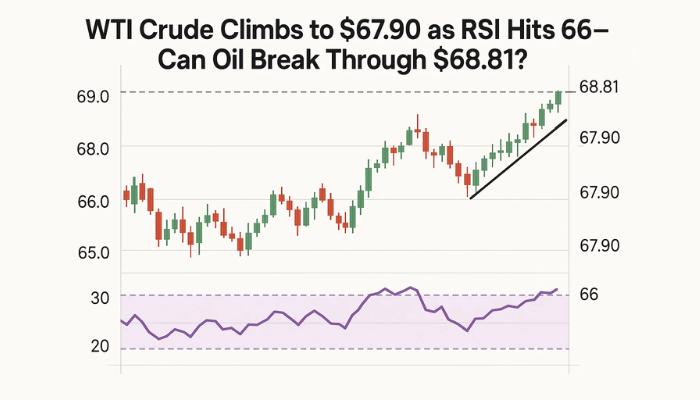
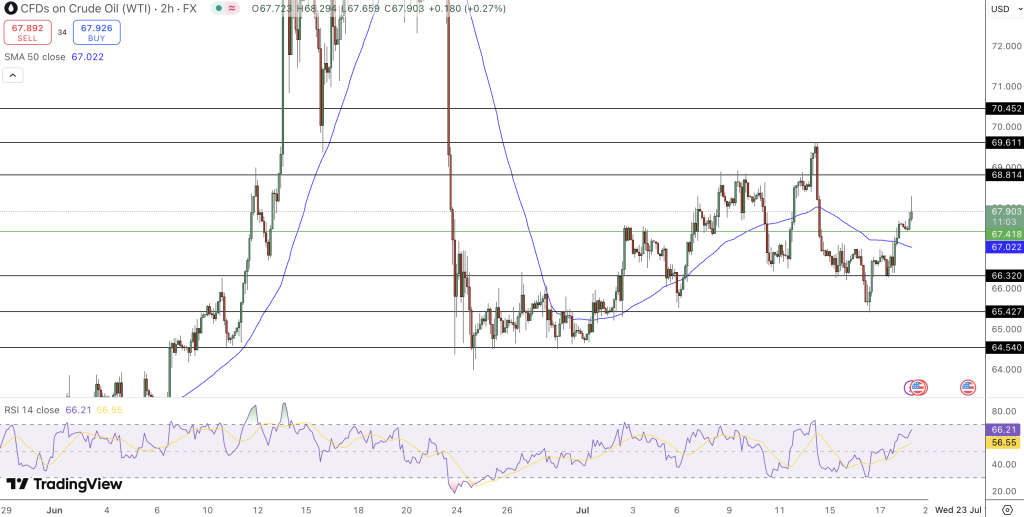
- Technically, WTI is supported by the 50 period Simple Moving Average at $67.02, with key resistance at $68.81.
- Future price movements will depend on upcoming economic data and the Federal Reserve's decisions regarding interest rates.
WTI crude oil went above $67.90 on Thursday as bulls reacted to a bigger than expected draw in US commercial inventories. The Energy Information Administration reported a 3.9 million barrel decline last week vs consensus of 1 million barrel draw. The data got oil out of the recent range of $66.30 to $67.00.
From a bigger picture, oil is being pulled in two different directions. OPEC+ is adding to the global supply, with recent increases of over 400,000 barrels per day since May and another 548,000 bpd in August. On the other hand, summer travel season and strong US fuel consumption is providing some tailwinds to demand.
Add to that the latest US economic data—softer retail sales and rising jobless claims—and the macro picture is cloudy. These data points suggest slowing growth which could temper oil demand in the coming months but also keeps pressure on the Fed to hold off on further rate hikes.
RSI Strengthens as Price Tests Moving Average
Technically, WTI is being supported by the 50 period Simple Moving Average (SMA) which recently turned from resistance to support at $67.02. Price is now approaching the horizontal resistance at $68.81 which capped the bullish momentum in early July.
Meanwhile the 14 period Relative Strength Index (RSI) is at 66.29, above 60 but not yet overbought. This kind of RSI behavior often precedes a test of key resistance zones especially when accompanied by a bullish price structure.
What makes this chart structure notable is:
- Higher low at $65.43, showing renewed buying interest.
- Clean reclamation of the 50 SMA after multiple rejections.
- RSI above 60, typical in early stage bullish momentum.
WTI Crude Oil: Key Resistance and Support Levels
Oil is now in a technical squeeze between key resistance at $68.81 and support at $67.02. A clean break above this upper boundary could open up $69.61 and possibly $70.45. Below $67.00 could revive bearish sentiment towards $66.32 or $65.42.
Key Resistance:
- $68.81 – Previous high and psychological barrier
- $69.61 – Early July high
- $70.45 – Monthly resistance
Support:
- $67.02 – 50 SMA
- $66.32 – Horizontal support
- $65.42 – Recent low
Conclusion
WTI crude went above $67.90 on technical recovery and changing macro sentiment. As RSI strengthens and price reclaims short term averages, traders will be watching for a clean break above $68.81. Whether oil goes up or stalls will depend on further data and how the market reacts to the Fed.
- Check out our free forex signals
- Follow the top economic events on FX Leaders economic calendar
- Trade better, discover more Forex Trading Strategies
- Open a FREE Trading Account
- Read our latest reviews on: Avatrade, Exness, HFM and XM
Related Articles


Sidebar rates
Related Posts
