Weekly Gold Price Prediction: Can Strong Unemployment Claims Sink XAU Below $3,000?
Gold prices remain trapped below their April peak as safe-haven demand meets fading momentum, with markets watching labor data and global te

Quick overview
- Gold prices are currently stabilizing below their April peak due to safe-haven demand and fading momentum.
- Weak U.S. employment data has contributed to a recent rebound in gold prices, but buyers struggle to reclaim the $3,450–$3,500 range.
- Jewelry demand has declined significantly, particularly in key markets like India and China, while central bank purchases continue to support gold prices.
- The future trajectory of gold will largely depend on upcoming U.S. economic data and geopolitical developments.
Live GOLD Chart

Gold prices remain trapped below their April peak as safe-haven demand meets fading momentum, with markets watching labor data and global tensions for the next trigger.
Market Overview
Gold has been stabilizing under record levels since late April, caught between geopolitical uncertainty and shifting Federal Reserve expectations. After the Fed left interest rates unchanged at last week’s FOMC meeting, XAU/USD briefly fell to $3,268 before rebounding strongly, supported by the 100-day simple moving average.
Weak U.S. employment data, which some investors questioned for accuracy, fueled the rebound into the weekend, so this week’s Unemployment Claims take extra importance for Gold traders, as they will confirm or dismiss Friday’s NFP data. Despite this, buyers have been unable to retake the $3,450–$3,500 zone, leaving GOLD in a prolonged consolidation phase.
Gold Chart Daily – The 100 SMA Held As Support

This consolidation comes after a powerful rally that began in late 2023, when safe-haven flows and central bank buying drove XAU/USD to its April 2025 peak of $3,500. Since then, momentum has cooled, and multiple attempts to break higher have failed, suggesting investor caution.
Gold Chart Weekly – Will the Uptrend Resume After the 20 SMA Caught Up?
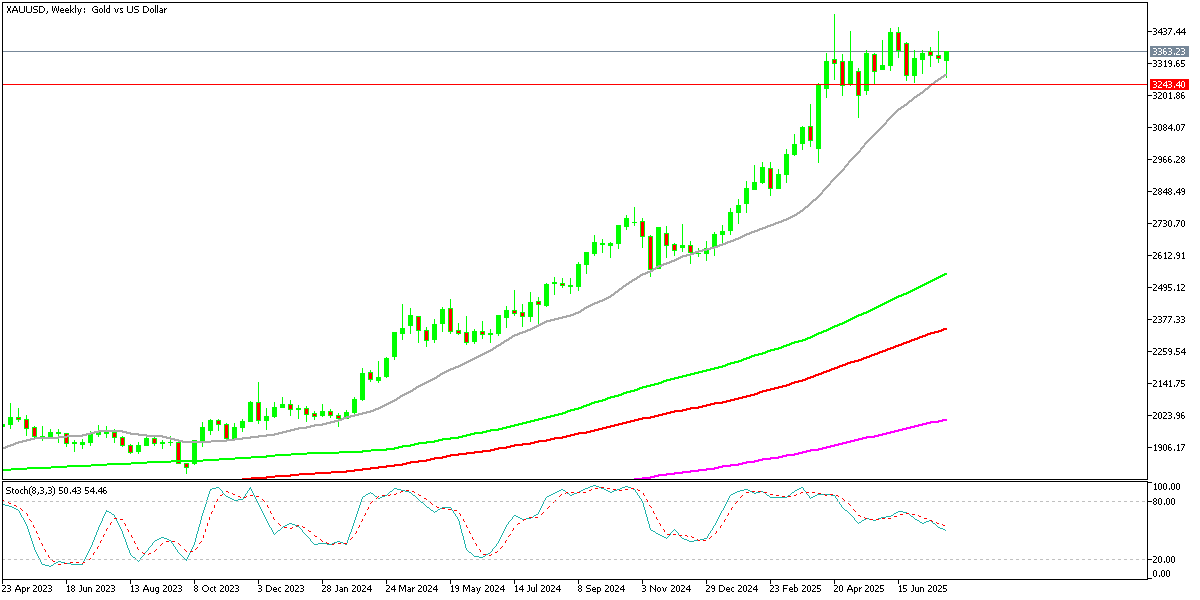
Sellers, however, have also struggled to force a decisive breakdown, leaving gold supported above $3,000—a psychologically important level that continues to attract dip buyers.
Demand and Market Dynamics
Beyond rate speculation, physical demand trends are shaping price action. Jewelry demand has weakened noticeably as high prices deter consumer purchases. According to the World Gold Council (WGC), global jewelry consumption dropped to 356 tons in Q2 from 435 tons in Q1. This decline highlights the growing price sensitivity in key markets such as India and China.
At the same time, central bank accumulation remains a critical pillar of support. Persistent gold purchases—particularly by China—reflect a broader push among nations to diversify away from the U.S. dollar. Analysts note that this “monetary demand” has helped gold hold its range even as jewelry demand falters and speculative flows cool. On the monthly chart, three consecutive doji candlesticks signal market indecision, hinting at a potential inflection point where either a breakout or a deeper retracement could emerge.
Outlook: Gold’s near-term trajectory will depend heavily on incoming U.S. economic data and geopolitical developments. Traders are watching this week’s U.S. unemployment claims and preliminary unit labor cost figures for additional signals on labor market health. A softer labor picture could reignite Fed rate-cut bets, providing a bullish catalyst for gold, while stronger-than-expected data might trigger further consolidation.
Longer term, analysts at the WGC maintain that the structural uptrend remains intact, driven by ongoing central bank accumulation and lingering geopolitical risks. Unless sellers gain momentum below $3,000, gold is likely to maintain its current range with a bias toward retesting its highs in the months ahead.
Gold Live Chart
- Check out our free forex signals
- Follow the top economic events on FX Leaders economic calendar
- Trade better, discover more Forex Trading Strategies
- Open a FREE Trading Account
- Read our latest reviews on: Avatrade, Exness, HFM and XM
Related Articles


Sidebar rates
Related Posts
