Gold Prices Rebound After 2.5% Slump as Traders Eye CPI for Rate Cut Clues
Gold prices stabilised on Tuesday after a big sell-off on Monday as traders turned their attention to US inflation data...
Quick overview
- Gold prices stabilized on Tuesday after a significant sell-off on Monday, influenced by US inflation data.
- The metal experienced a 1.6% drop in spot trading and a 2% decline in futures following President Trump's announcement regarding tariffs on imported gold bars.
- Economists expect July's core CPI to rise by 0.3% to 3%, which could impact the Federal Reserve's decision on interest rates.
- Technically, gold's short-term outlook appears bearish, with key support levels identified at $3,314, $3,287, and $3,268.
Gold prices stabilised on Tuesday after a big sell-off on Monday as traders turned their attention to US inflation data that could influence the Fed’s next move on interest rates.
The metal fell 1.6% in spot trading on Monday and 2% in futures after President Donald Trump said imported gold bars would not be subject to tariffs. That removed a layer of uncertainty that had been rattling bullion traders.
“Market participants will now be focusing on the Fed’s rate cut, which is largely priced in for September,” said Kelvin Wong, senior market analyst at OANDA. “If the core CPI comes in slightly below expectations, that could further support this outlook.” Lower interest rates tend to boost non-yielding assets like gold and the US 10-year Treasury yield is below key resistance levels.
Inflation Data to Set the Tone
Economists polled by Reuters expect July’s core CPI to have risen 0.3% to 3% – still above the Fed’s 2% target. According to CME’s FedWatch tool, traders see an 85% probability of a September rate cut.
With CPI data out at 12:30 GMT, a softer reading could strengthen the case for looser policy, while a surprise to the upside might temper expectations. Gold tends to do well in lower interest rate environments and during periods of uncertainty, so this release is key for short-term direction.
Gold (XAU/USD) Technicals Signal Caution
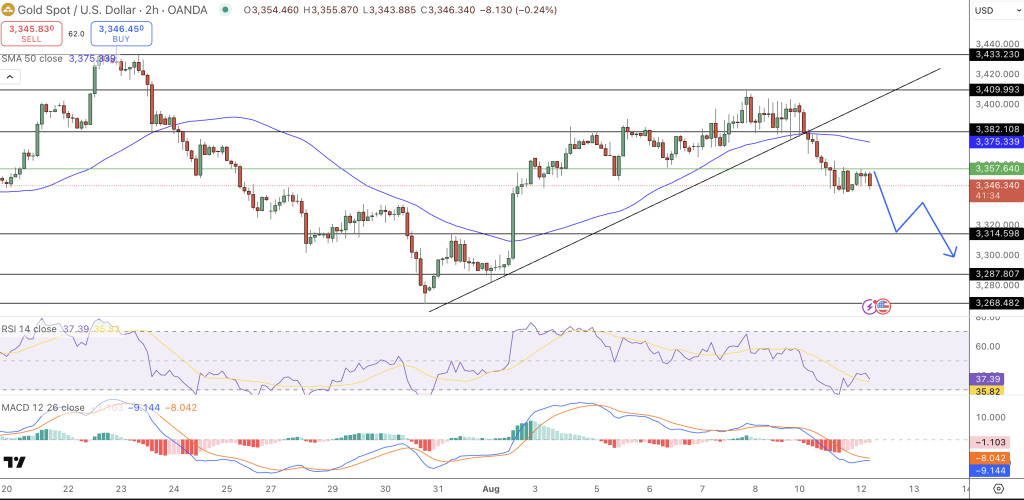
From a technical perspective, gold’s short-term chart is bearish. Prices failed to hold above the 50-period exponential moving average at $3,375 and broke below a rising trendline, so momentum has shifted. The rejection candle at $3,382 and successive lower highs indicate weakening buying pressure.
Momentum indicators agree. The RSI is at 37, so there’s room for further downside before oversold conditions emerge and the MACD is bearish.Support at $3,314, below that $3,287 and $3,268. For traders, a retest of $3,357-$3,360 could be a short, target $3,314 then $3,287, stop above $3,382. As always, price action confirmation, not chasing, is key.
- Check out our free forex signals
- Follow the top economic events on FX Leaders economic calendar
- Trade better, discover more Forex Trading Strategies
- Open a FREE Trading Account
- Read our latest reviews on: Avatrade, Exness, HFM and XM
Related Articles


Sidebar rates
Related Posts
