Bitcoin Price Prediction: Powell’s Signal and Chart Breakout Eye $124K
Bitcoin above $116,000 as Powell’s Jackson Hole comments spark optimism across markets. He said labor market stability...
Quick overview
- Bitcoin has surged above $116,000 following Powell's optimistic comments at Jackson Hole, with a 90% chance of a September rate cut.
- Historically, dovish pivots at Jackson Hole have led to significant Bitcoin rallies, with analysts predicting a potential 77% increase by year-end.
- Technical indicators show Bitcoin is in recovery mode, with strong buying support and bullish candlestick patterns suggesting upward momentum.
- Current trading strategy suggests going long above $116,200, targeting resistance levels at $119,300 and $121,800.
Bitcoin above $116,000 as Powell’s Jackson Hole comments spark optimism across markets. He said labor market stability over inflation targeting and CME FedWatch gives a 90% chance of a September rate cut.
Risk on. Bitcoin up from $112,000 and back above $116,000. Historically, dovish pivots at Jackson Hole have led to big rallies: Bitcoin up 200% after Powell’s 2023 speech and 100% in 2024. Analysts now expect another 77% by year end.
Bitcoin Charts Point Up
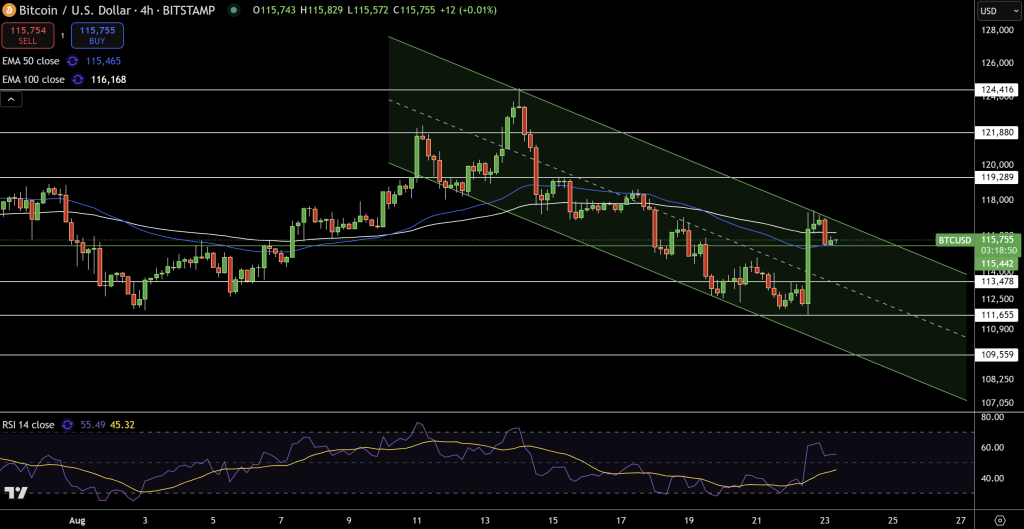
Bitcoin is in recovery mode. On the 4 hour chart, BTC has been in a descending channel since mid August, with lower highs and lower lows. The bounce took price back above the 50-EMA ($115,465) but the 100-EMA ($116,168) is immediate resistance.
Bitcoin & broader crypto rebound on Fed signal
Fed Chair Powell hinted at a potential rate cut, sending Bitcoin surging to around $116.5K (from sub-$112K), while altcoins (ETH, SOL) also lifted. Risk appetite quickly bounced.#Bitcoin #crypto #CryptoCommunity— Basic Knowledge (@bk_knowledge) August 22, 2025
Candlestick patterns are encouraging. A long lower wick at $111,655 means strong buying at support and the latest cluster of green candles at the bottom of the channel is a mini “three white soldiers” – a bullish reversal pattern. RSI is back up to 55 and MACD is positive – momentum is shifting in favour of buyers.
Updated levels:
- Support: $113,500, $111,650, $109,550
- Resistance: $116,800, $119,300, $121,800, $124,400
If Bitcoin breaks $119,300 it will be out of the channel and $121,800 and $124,400 are next. If it can’t hold $113,500 it will be back to $111,650.
BTC/USD Q4 2024 Into 2025
With technicals building and macro from Powell’s dovishness, Bitcoin looks good for another strong Q4. Current price action is accumulation phase where $112,000-$116,800 is the launchpad for higher prices.
Trade: Long above $116,200 (100-EMA) with stop $113,500. Targets $119,300 and $121,800, then $124,400. Risk defined.
- Check out our free forex signals
- Follow the top economic events on FX Leaders economic calendar
- Trade better, discover more Forex Trading Strategies
- Open a FREE Trading Account
- Read our latest reviews on: Avatrade, Exness, HFM and XM
Related Articles


Sidebar rates
Related Posts
