Selling the Retrace in USD/CAD at the 20 SMA
USD/CAD has formed a pin candlestick at the 20 SMA, which is a bearish signal
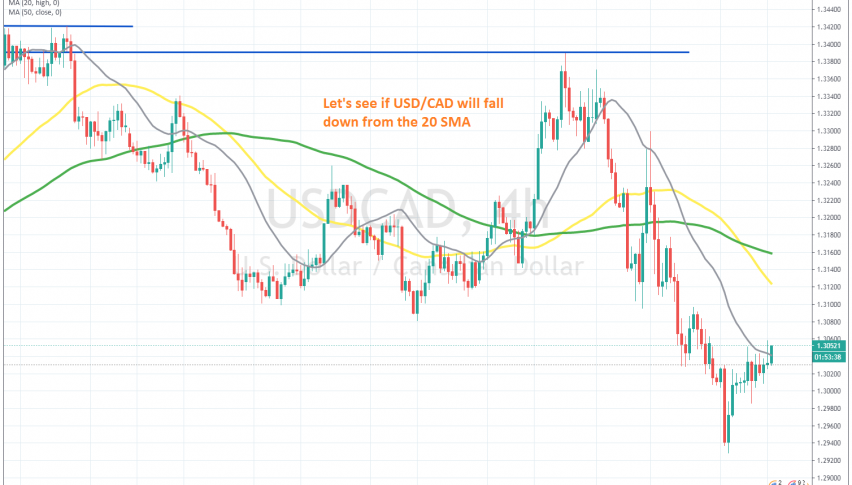
The USD/CAD turned bearish again last week, after it bounced off the 1.30 area in early September, climbing above 1.34. But, after a second attempt, and the failure by the buyers to hold onto gains at around 1.34, the sellers finally returned last week, as the USD crashed lower during the election week in the US.
Crude oil has also been helping the CAD, since it has climbed nearly $ 10 in about a week, from $ 33.50s to $ 43 earlier today. The CAD benefits from higher oil prices, with Canada being a major oil exporter. So, the pressure has shifted to the downside for this pair once again.
The USD/CAD fell below 1.30 last week, but it has been retracing higher this week. However, we decided to sell this retrace higher at the 20 SMA (gray) on the H4 chart. The price formed an upside down pin candlestick at this moving average, which is a bearish reversing signal after the retrace, so we decided to take this opportunity and go short on USD/CAD.
- Check out our free forex signals
- Follow the top economic events on FX Leaders economic calendar
- Trade better, discover more Forex Trading Strategies
- Open a FREE Trading Account
- Read our latest reviews on: Avatrade, Exness, HFM and XM
Related Articles


Sidebar rates
Related Posts
