Natural Gas is the most important source of energy, after oil and coal. The use of natural gas has been increasing rapidly, and it is expected that this fuel will overtake coal, and shift into second place, by 2030.
The largest producing countries of natural gas are the United States, Russia, Iran, Qatar, Canada and Norway. It is not only produced in these countries. They also exported it to other countries around the world, due to its abundance. For the export process, the gas is transported through pipelines or as liquefied natural gas (LNG).
Almost a quarter of the US energy consumption is based on natural gas. The national benchmark price is usually driven by the NYMEX Division’s natural gas futures contract, which trades in units of 10,000 mmBtu. The price fluctuations in natural gas depend on many factors, including the supply and demand side of the market, which covers the US natural gas production, US oil production, exports to Mexico, underground storage levels, weather conditions, LNG exports, economic conditions, and alternative fuel prices.
Natural Gas – Historical Price Charts and Data
Natural Gas – Historical Price Charts:
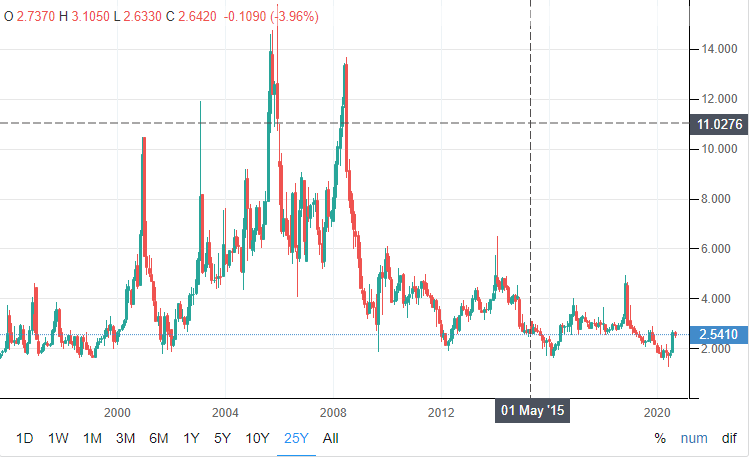
25-Year Chart
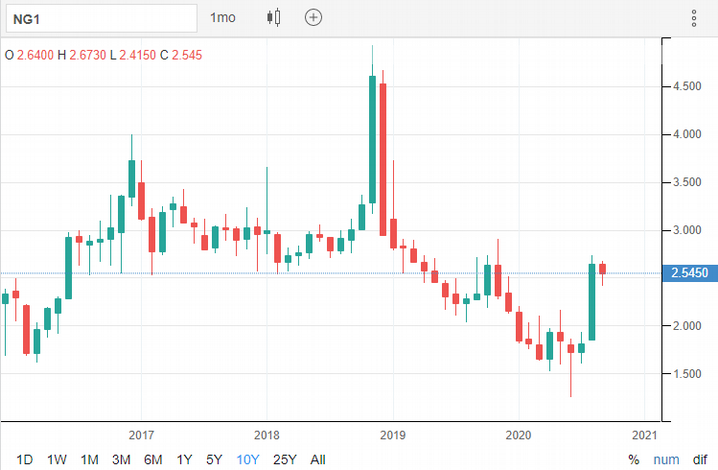
10-Year Chart
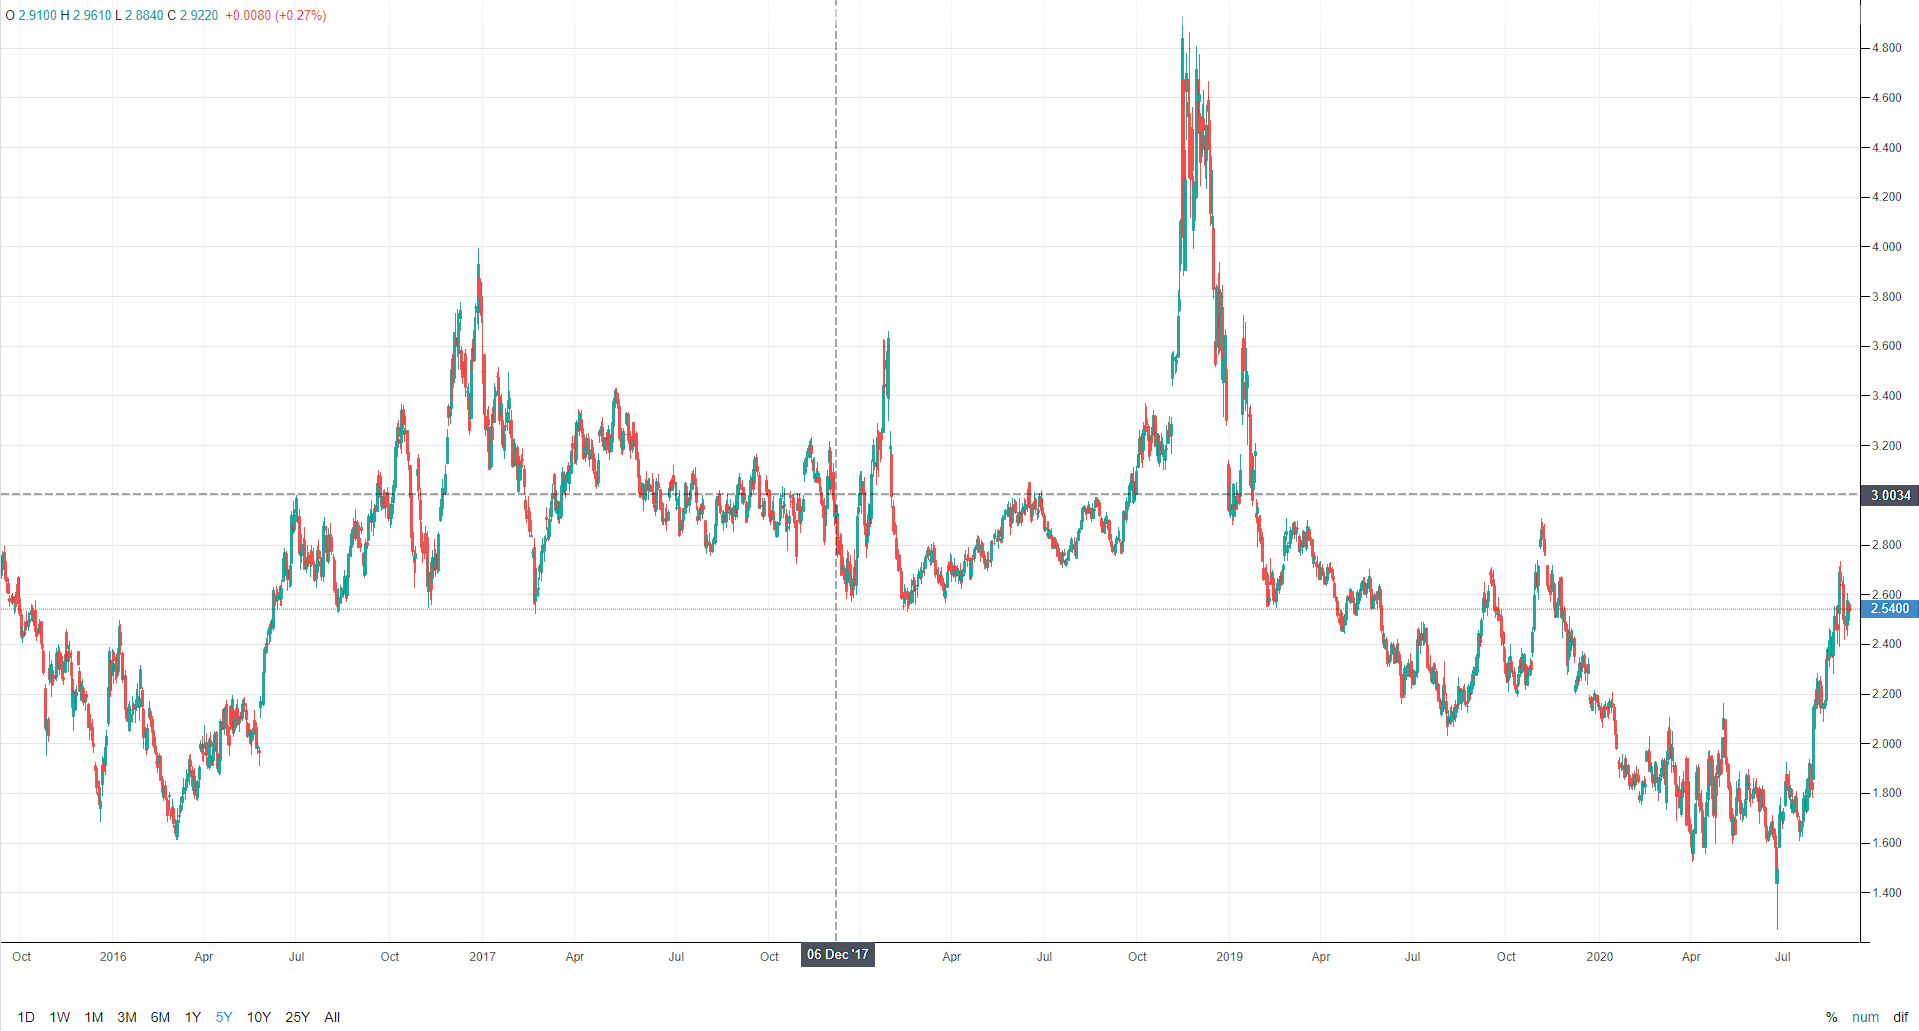
5-Year Chart
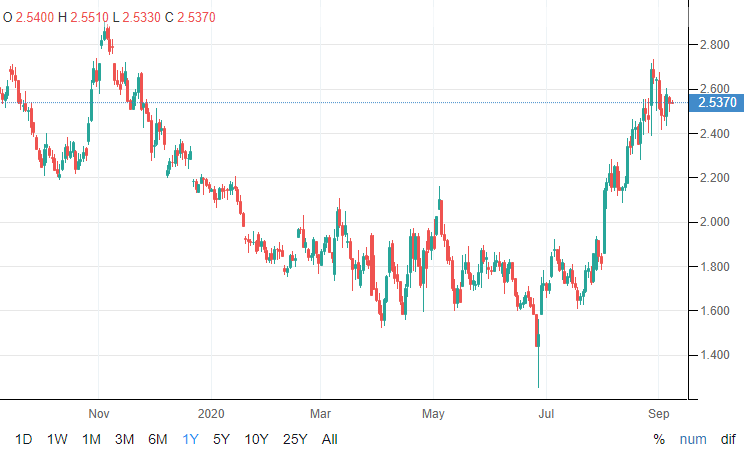
1-Year Chart
Why Look at Historical Natural Gas Prices?
There are manifold factors involved in the determination of a bearish bias in natural gas. Let’s explore them one by one, in order to forecast the natural gas price.
Reduction in Demand/Consumption due to mild weather – Natural gas fell in its major markets over the first months of this year, due to historically mild temperatures in the northern hemisphere. According to natural gas transmission system operators, the milder weather in Europe pushed down the natural gas demand by a projected 2.6% in the first quarter of 2020, against the previous year. The combination of low heating-related energy consumption and high wind generation caused a 3% decline in natural gas consumption by distribution customers, and a 5% decline in gas-fired power generation.
On the contrary, the demand for natural gas in the United States decreased by 4.5% in the first quarter of 2020, against the previous year’s prices. This was followed by a sharp decline in residential and commercial demand, by almost 18%. The natural gas consumption in mature Asian markets also contracted, as the LNG imports in Japan fell by 3% in the first quarter of this year. The domestic sale of natural gas in Korea also contracted by 2.5% in the first 2 months of the year. The demand in Russia and other Eurasian markets also dropped, as the Russian electricity consumption in the first three months of 2020 declined by 1.9%. This low demand, due to lower consumption because of the mild weather, caused a bearish trend in Natural Gas.
Growth in Supply – The global LNG trade increased by 13% in Q1 this year, as US dry gas production grew by 7%. Over this period, Europe had a share of almost 60% of the LNG imports. The underground storage inventories surged, and the pipeline imports decreased in both the EU and the US. The US stockpiles of natural gas rose by 77% from the previous year. This rise was 17% above the average 5-year level. Meanwhile in Europe, the storage inventories rose by 40%, to a level that was 80% above the 5-year average. The exceptionally low spot prices supported all these gains in stockpiles. This year, the US Henry Hub spot prices for natural gas were at the lowest average level for Q1 since 1999. Meanwhile, the European TTF price reached its lowest level since its establishment in 2003. The rising storage volumes of natural gas also weighed on the prices.
The Coronavirus Pandemic-induced lockdowns – The COVID-19 outbreak, that reached its peak in February, caused a massive contraction in gas consumption, to a level close to zero. The global usage of natural gas in industrial and power-generation sectors was reduced in mid-March because of the lockdown restrictions, which were imposed in an effort to control the spread of the coronavirus. However, the distribution network consumption was not affected, due to the reasonable demand from the residential side. In Europe, the demand for natural gas fell, with Germany reporting a 3% decline, and the Netherlands reporting a 7% decline, relative to 2019. But the pressure remains on natural gas prices, as fears of a second wave of the coronavirus are weighing on the market. However, the pressure will be low compared to March, as lockdowns have been lifted, and economies have started to grow again. The slower economic activity decreased the industrial consumption of natural gas by 1.4 Bcf/d in July, compared to the previous year, off-setting the consumption and weighing on natural gas prices.
Hurricane Laura – Recently, Hurricane Laura made landfall and disrupted numerous LNG export plant and refinery operations. This disturbed the export of natural gas and affected the prices for the commodity.