Forex Currency Pairs: Looking at the Majors
Talking points:
-
Market reactions during this past week
-
Where the majors are heading
-
Levels to watch, and trade setups
Market reactions this past week
The foreign exchange market has been subject to an expansion of volatility these last couple of weeks, with the Brexit theme certainly being the main cause of this uproar. However, the start of this week saw the Japanese Yen plummet several hundreds of pips against an array of currencies. I was lucky enough to enter long trades on USD/JPY and AUD/JPY early on Monday morning, which I closed out on Tuesday evening. Some of these trades achieved a risk to reward ratio of more than 1:24 which gave my trading account a decent boost.
Furthermore, the pound sterling (British Pound) had quite a choppy day today as the Bank of England (BOE) thwarted the market’s expectation of a rate cut by keeping their overnight benchmark rate unchanged at 0.5%. This caused a very aggressive spike in the GBP/USD of about 235 pips in less than 5 minutes. However, this impulsive buying was quickly countered by sellers pushing down the pair more than 170 pips from the daily high. Since then, the pair has been chopping around back and forth.
Where the majors are heading
Let’s jump to a few charts on the major pairs…
EUR/USD:
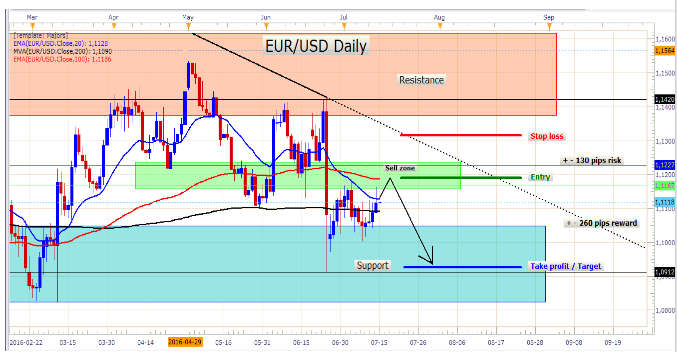
The EUR/USD daily chart, with support, resistance, and a sell zone indicated.
The EUR/USD has been in a frustrating range for about 14 trading days after the ‘Brexit’, with prices being chopped around the 200 day moving average. The 20EMA (blue line on the chart) has capped prices in these last couple of days, with prices rejecting it again today.
I am not too fond of trading this pair right now, with retail sentiment being too flat to my liking at the moment (the retail crowd is not overwhelmingly leaning to either the long or the short side of the market). Retail sentiment readings are used as a contrarian indicator to price movements. For example, when the retail crowd is overwhelmingly engaged in short positions on a certain currency pair, the market tends to move against them and rise to new highs, as the majority of retail traders are normally wrong at predicting the direction of the market. They tend to try and pick tops and bottoms and frequently trade against the prevailing trend. I like to trade those currency pairs which are trending strongly and have extreme retail sentiment readings.
Nevertheless, the Eurozone’s political and financial risks confirm my bearish bias on this pair, and I believe that the risk is tilted to the downside on this pair for now.
Trading setup for the EUR/USD:
The green box on the chart marks my sell zone, with my entry at about 1.11900, a stop loss at about 1.13155, and my take profit at about 1.09264. This gives us a target of about 260 pips risking only about 130 pips. Proper money management is vital to surviving as a trader. If the market moves in our direction, the stop loss can be moved to break even when the trade is in profit by about 100 to 130 pips.
GBP/USD:
Due to the ‘Brexit’, the British Pound has been dangerously volatile, and since the vote to leave, the GBP/USD has seen abnormally large price swings. As mentioned earlier in this article, market expectations concerning the pound are pretty high. This makes trading the pound tricky at this time. Nevertheless, I have been scalping the GBP/USD and have made a bit of money these last couple of days.
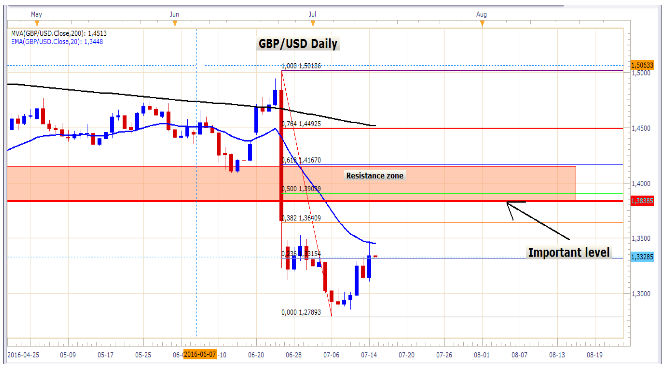
The GBP/USD daily chart, with resistance zone indicated
The BOE is expected to increase economic stimulus soon, and coupled with the risks associated with the Brexit theme, the pound is expected to trade lower. Depending on the size and manner of the stimulus, the pound might even lose another thousand pips. If price retraces up to the red line on my chart, I will surely consider selling there. Just be warned that if for some reason the Britons decide to run back to the EU, the resulting relief rally would be quite severe.
USD/CAD:
Trading the USD/CAD has been more difficult as of late, with this pair moving steadily down from a 2016 high, which was set in January. I’m sure the range it has found itself in these last couple of days has greatly frustrated many traders. However, the low that has been set on the 3rd of May seems to be holding pretty well, and if it continues to hold with oil falling, we might see the pair rise towards the yearly high again. Just take note that current price action is below the 200 day moving average, and resistance needs to be broken first before we can get excited about further upside. I will be on the lookout for a retest of former resistance (which might turn into new support). After that price has broken through the resistance zone marked on the chart. Please note the red circle and red arrow.
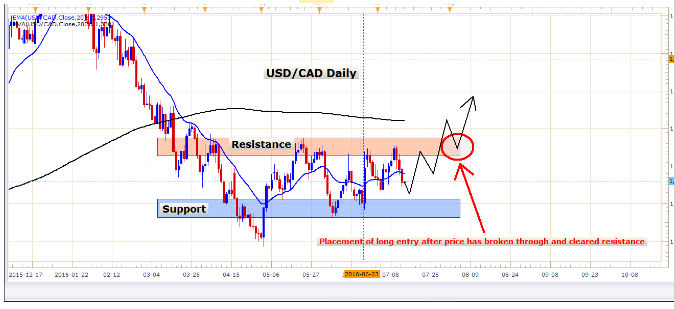
The USD/CAD daily chart, with support and resistance zones
USD/CHF:
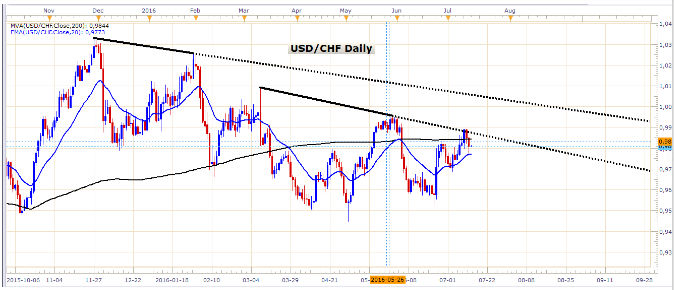
USD/CHF Daily chart
I’m not very excited about this pair at the moment, however, traders might play the range to make some pips. The price action has been very much sideways with a slight bearish bias.
AUD/USD:
The AUD/USD has been holding steady above both the 20 EMA and the 200 MVA and has recently set what looks like an important low. I would not be amazed if we saw this pair extend its gains further towards the 0.8000 level. However, there are still a lot of global financial risks which might pose a problem for the Aussie, in terms of a lack of demand for certain commodities which are exported from Australia to the rest of the world, but especially to China. For now, my bias remains bullish for this pair.
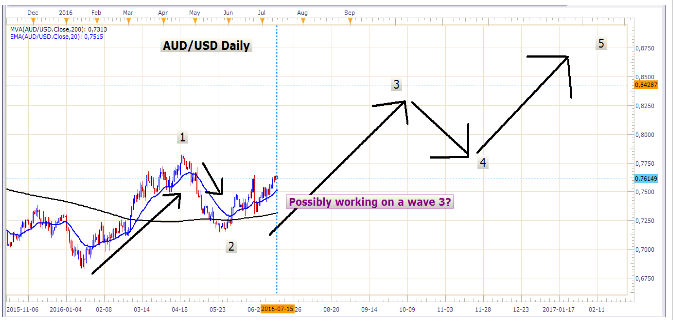
Chart: AUD/USD Daily chart with Elliot wave count
That’s all for today fellow traders, good luck trading!!
- Check out our free forex signals
- Follow the top economic events on FX Leaders economic calendar
- Trade better, discover more Forex Trading Strategies
- Open a FREE Trading Account