Pound Sterling Caught in the Crossfire – The GBP/USD is Declining Steadily
The British pound has lost about 500 pips in the last 9 trading days. The pair has virtually been declining in a straight line this period and i It is no secret that the bears are clearly dominating the scene here. Market players seem to have made up their mind about the state of the UK economy, and it doesn’t look like there is light at the end of the tunnel yet. The UK is feeling the pain of their decision to leave the UK, and likewise, the pound is taking a beating.
Today we have a long list of economic data releases out of the UK, with the average earnings index and CPI numbers probably being the most important to watch. We also have important data out of the US including CPI numbers. Now if the UK data disappoints and the US data comes out better than expected, the result could be a further decline in the GBP/USD. Just remember that we have the FOMC meeting minutes released tomorrow at 18:00 GMT which could perhaps move the markets a lot. However, the meeting was held before July’s strong US nonfarm payrolls numbers were released, so the information contained in the minutes might be regarded by many market participants as ‘old news’. Nevertheless, the FOMC meetings have impacted the FX market tremendously in the past, and traders should be prepared for volatility even if we might not get a lot of it. Sometimes market participation is low in the two days preceding the FOMC minutes, but this is not a given. Let’s look at some Cable charts:
GBP/USD
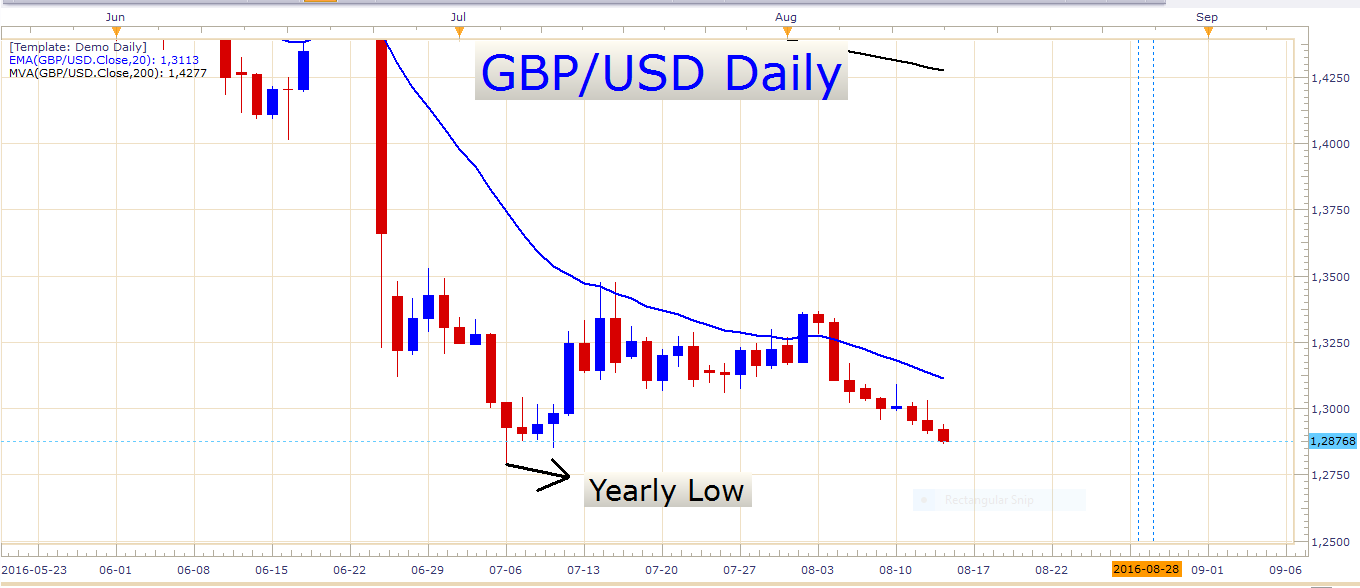
GBP/USD Daily Chart
Look at all the red candles in a row. It has been relatively easy to make money on this pair in the last couple of days, and selling bounces have been very profitable. As you can see the pound is on the back foot and the pair is fast approaching the yearly low, with only about 80 odd pips needed to reach it. If this support breaks, we might see the pair extend its decline even further. Certainly, we could see some profit taking towards the yearly low which could slow down the decline somewhat. There could even be a bounce lurking around the corner, who knows? However, at the moment we cannot ignore the fact that the trend on all time frames is down. The question is just where to enter a trade. I like the idea of selling bounces. Let’s examine a 4-hour chart:
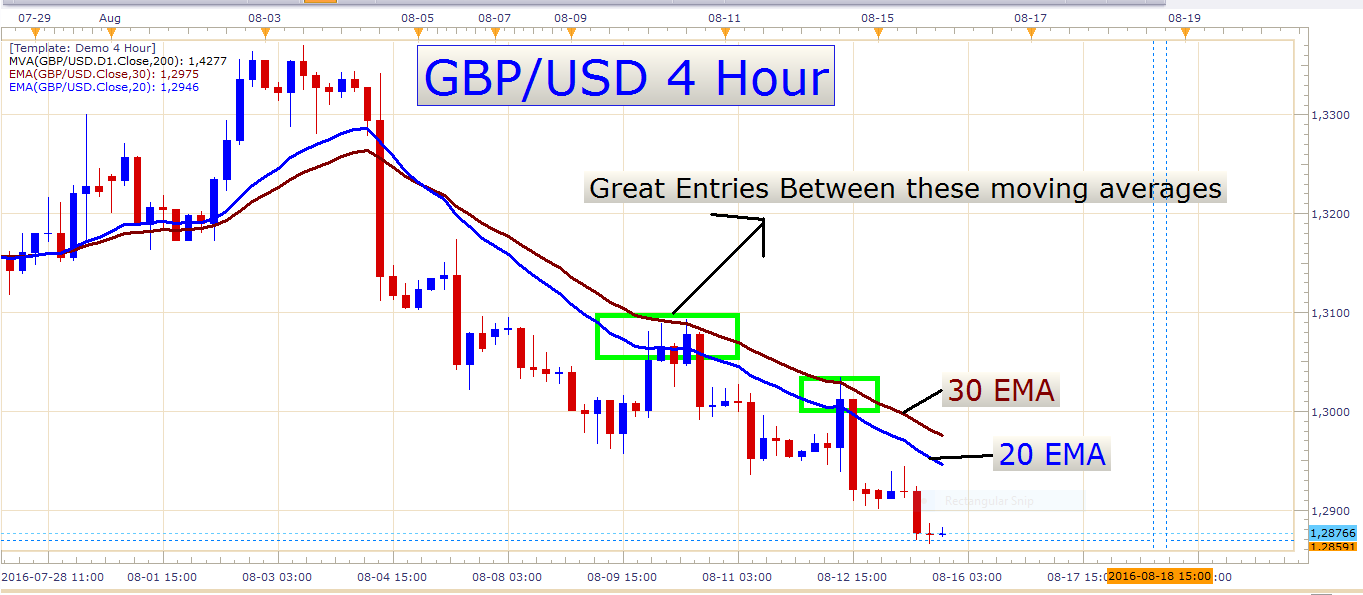
GBP/USD 4 Hour Chart
Here we notice that entries taken between the 20 EMA and 30 EMA have been very profitable. The advantage of selling bounces like this is that you can use a tight stop and easily aim for a target of 2 or 3 times the distance of your stop loss. A reasonable stop loss would be in the region of 50 to 70 pips, with a target of 100 to 150 pips. Perhaps we might get an opportunity like this today. Entries can also be taken on an hourly chart, but lately, the 4-hour chart has proven to be more reliable when looking at e.g. the 20 EMA. This might change very quickly of course, especially if the pair’s decline accelerates, the hourly chart with a 20 EMA might offer better levels to sell the pair at. With a very strong rise or decline, price often doesn’t retrace to the 20 EMA on a 4-hour chart for extended periods of time. This would cause a trader waiting for the price to reach the 20 EMA on a 4-hour chart to miss many valuable entries. This is where experience comes in handy, as it helps traders to identify high probability techniques and the right time frame to use for the specific market condition.
I like the extreme retail sentiment on the GBP/USD. For every short trader, there are about three long traders who are trying to fight the trend. This suggests that further losses might be on the way for the GBP/USD.
Let’s briefly look at some other major pairs.
USD/CAD
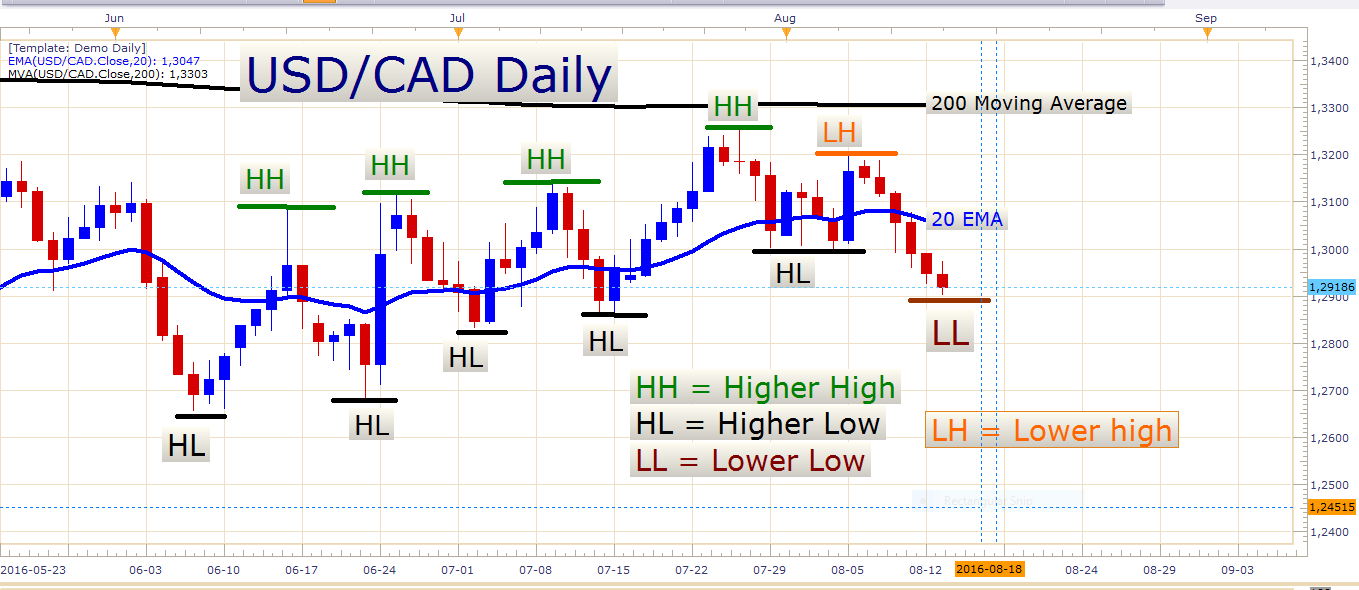
USD/CAD Daily Chart
As you can see the pair made a fresh low today. The bears have not run out of steam yet. Oil is contributing to the pair’s decline a lot, and we might see further weakness in the pair if oil keeps pressing into new heights. Look at an hourly chart:
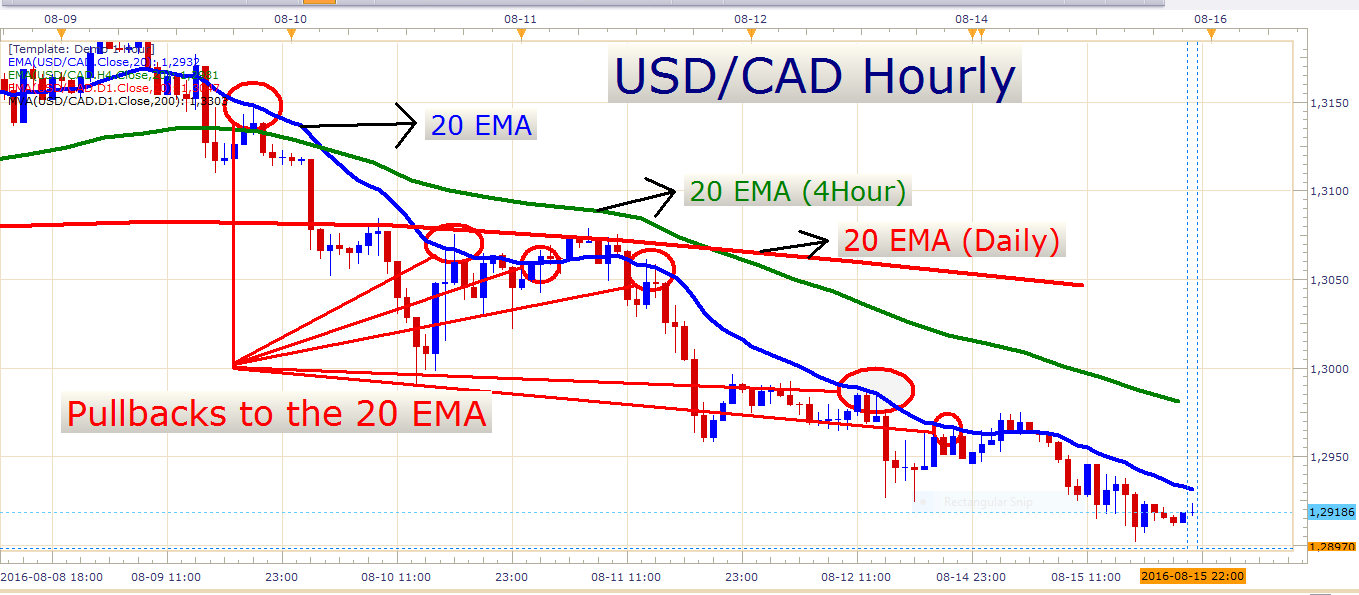
USD/CAD Hourly Chart
I will continue to watch out for pullbacks to the 20 EMA for opportunities to short this pair.
USD/JPY
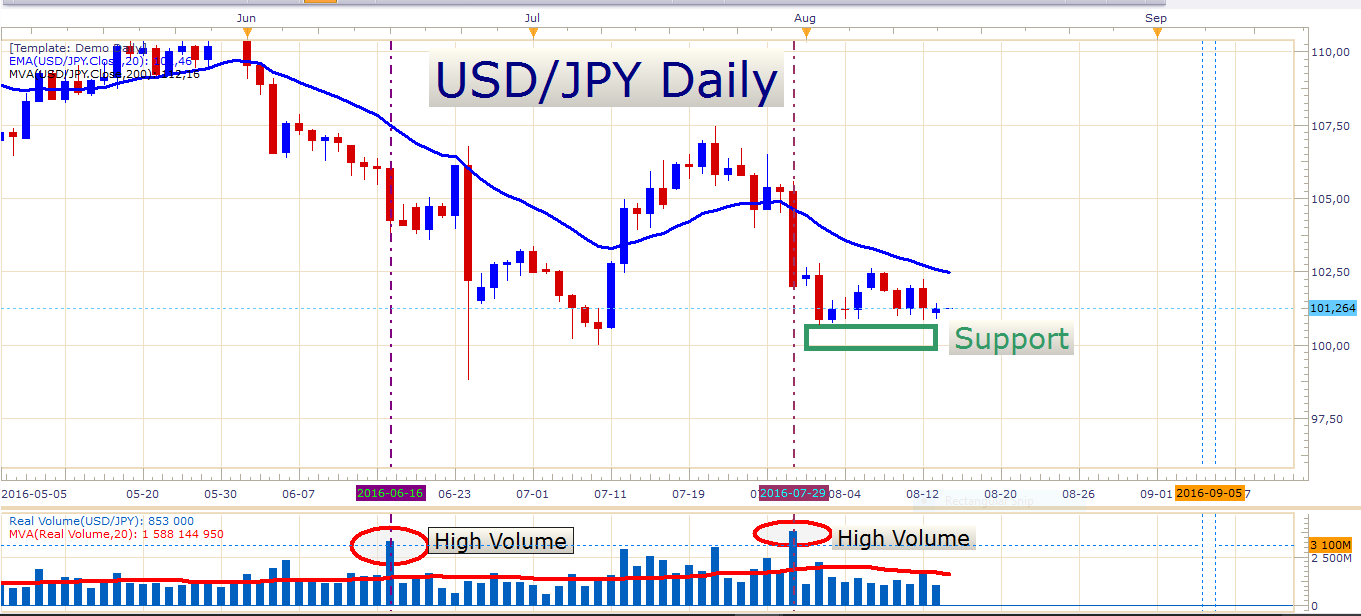
USD/JPY Daily Chart
I am still optimistic about further downside on this pair. With equities currently trading at sky-high prices, the Yen could strengthen considerably if perhaps the equity markets run into a correction soon. This could catapult the USD/JPY through the stubborn 100 level in no time.
AUD/USD
In a few hours’ time, the RBA (Reserve Bank of Australia) monetary policy meeting minutes will be released at 01:30 GMT. This could move the Aussie, so keep an eye out for this if you are trading the pair.
Good luck trading out there!
- Check out our free forex signals
- Follow the top economic events on FX Leaders economic calendar
- Trade better, discover more Forex Trading Strategies
- Open a FREE Trading Account
- Read our latest reviews on: Avatrade, Exness, HFM and XM
Related Articles


Sidebar rates
Related Posts
