Where are the Big FX Trends?
Trading the majors these past few days has been tricky. There has been a decent exchange rate fluctuation here and there, but many pairs have been pretty stagnant. For example, the GBP/USD has been trading in a range for the last 35 trading days. Since the Brexit happened, and the monumental drop in the pound had found support, there has been no clear direction for the GBP/USD. Despite the recent bounce in the EUR/USD, this pair has also been trading in a large range for more than a year. The USD/CHF has also been sideways for almost two years now. Although the USD/JPY has been in a well-defined downtrend for roughly the last year, it has been trading in a tight range for the last few days. Notwithstanding, there are some tradable major pairs, and the USD/CAD is certainly one of them. Let’s look at a daily chart:
USD/CAD
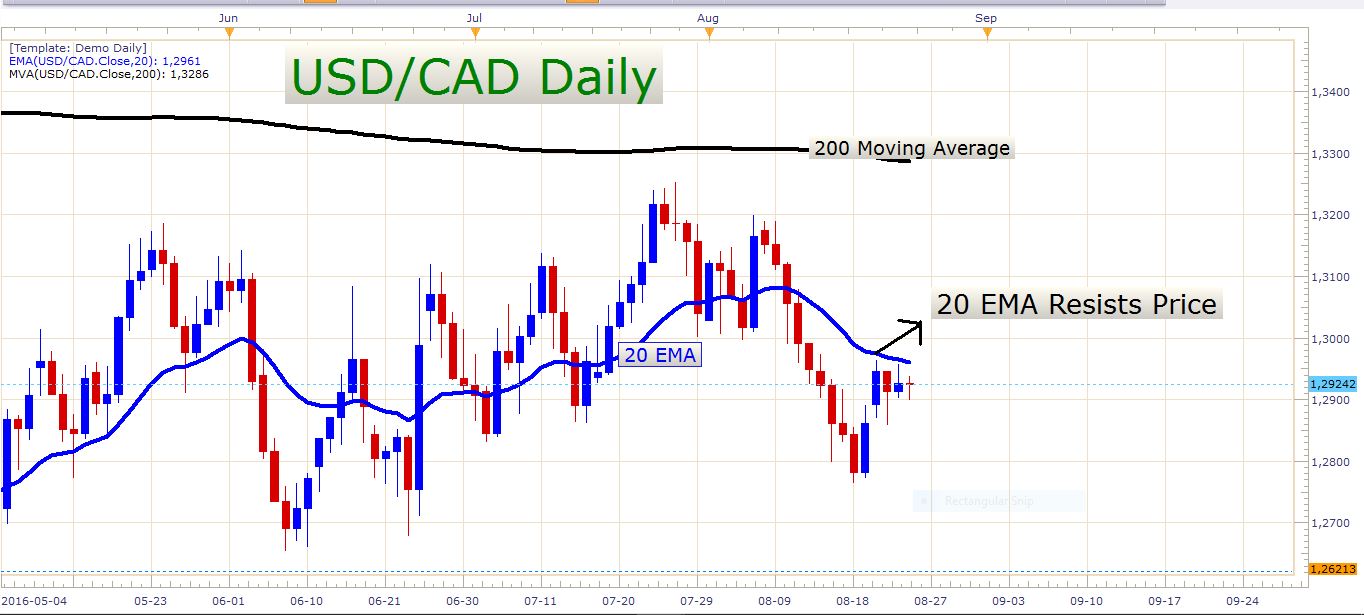
USD/CAD Daily Chart
If you look at this chart it is difficult not to notice the recent selloff of nine consecutive days. As I recently mentioned in another article, the last time this happened was many years ago. Oil prices are still buoyant, and if we see a further price increase in this commodity the Canadian dollar bull trend could quickly reassert itself. As you can see in the chart above, the USD/CAD looks like it has bumped its head against 20 EMA resistance. The recent bounce looks somewhat exhausted, and I wouldn’t be surprised if we get another leg down soon. I have already entered a short position on Monday which hasn't made any progress up until now, but it certainly has a lot of potential. I also managed to capture a few pips by scalping this pair today. Traders interested in entering short positions on the USD/CAD still have the opportunity to do so at a good price. Entries can be taken in the region of the current price (1.29180) or at the 20 EMA on a daily chart. I entered at 1.29186. My stop loss is well protected by the 20 EMA and sits at 1.30174. My take profit is set at 1.27186. This means for every pip I’m risking I’m targeting two pips, and my reward to risk ratio is 2:1.
Let’s take a look at the USD/CHF
USD/CHF
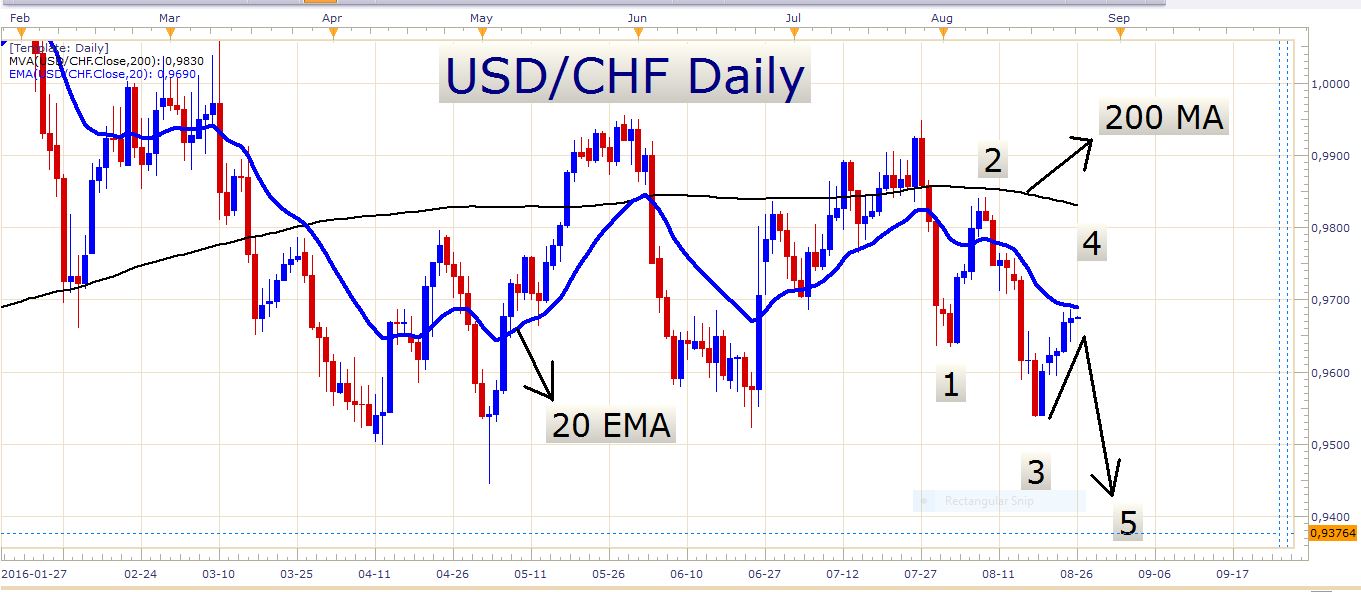
USD/CHF Daily Chart
I really like it when price trades up to the 20 exponential moving average (20 EMA) like this and starts to slow down when it approaches it. It looks like the 20 EMA might be a key level of resistance which means that the current price level might be a bargain to sell the pair at. The USD/CHF is currently at a price level where we have seen a lot of action in the past in terms of where important support and resistance levels were found. Look at the following chart:

USD/CAD Daily Chart
Look at the red circles and the horizontal green line. Notice how many times price reacted to this level by either forming resistance or support. This level has been a turning point for the price many times in the period displayed above. Will it be an important turning point again? Perhaps this is the point at which we will see the start of a fifth wave in terms of Elliot Wave theory (look at the numbers 1 to 5 on the chart above).
AUD/USD
I am still holding on to my short positions on this pair. Today was the fourth day on which price failed to close above the 20 EMA, with yet another candle shadow piercing this exponential moving average and rejecting off of it. This strengthens my bearish bias on this pair and I still expect some further downside over the next few days. Look at the daily chart below and notice the last four candle wicks (candle shadows) that pierced the 20 EMA:
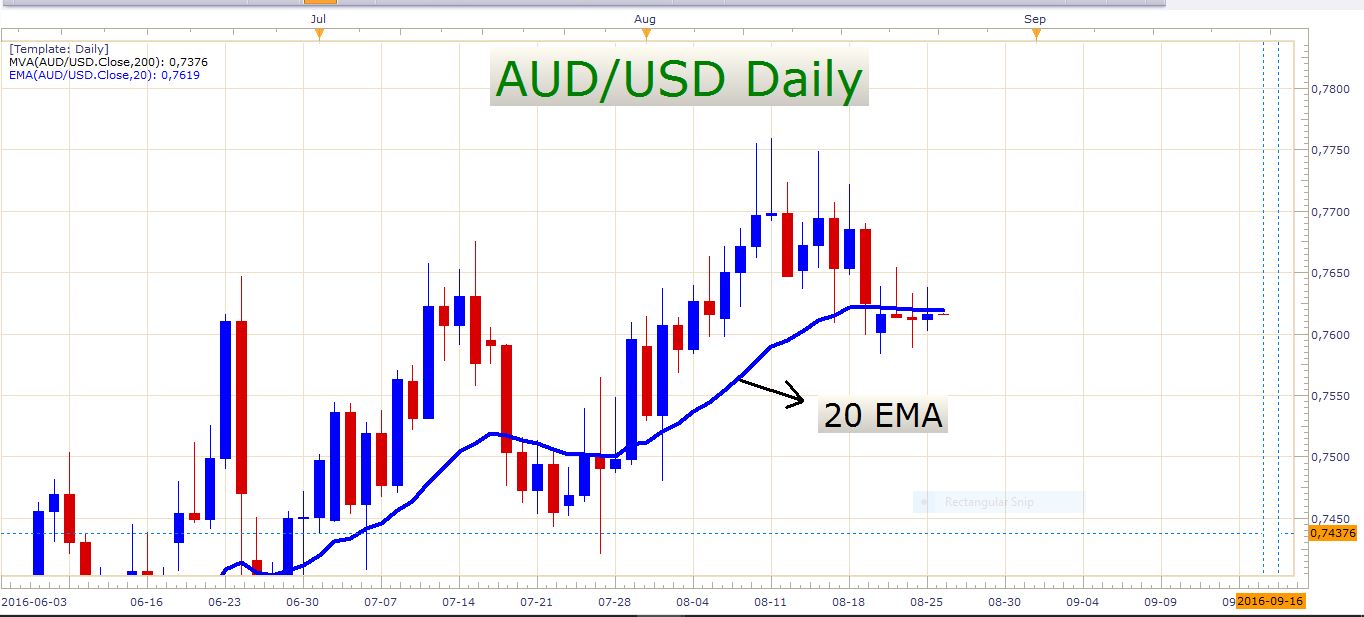
AUD/USD Daily Chart
Furthermore, we have some important economic data releases tomorrow. The UK and the USA are releasing second quarter GDP numbers. However, the most important event tomorrow might be FED chair Janet Yellen’s speech at Jackson Hole which is going to be at 14:00 GMT. Perhaps market players will get a hint at when the next US rate hike could be.
Have a profitable day!
- Check out our free forex signals
- Follow the top economic events on FX Leaders economic calendar
- Trade better, discover more Forex Trading Strategies
- Open a FREE Trading Account


