Is The Aussie losing Its Bounce? AUD/USD Slammed at Resistance
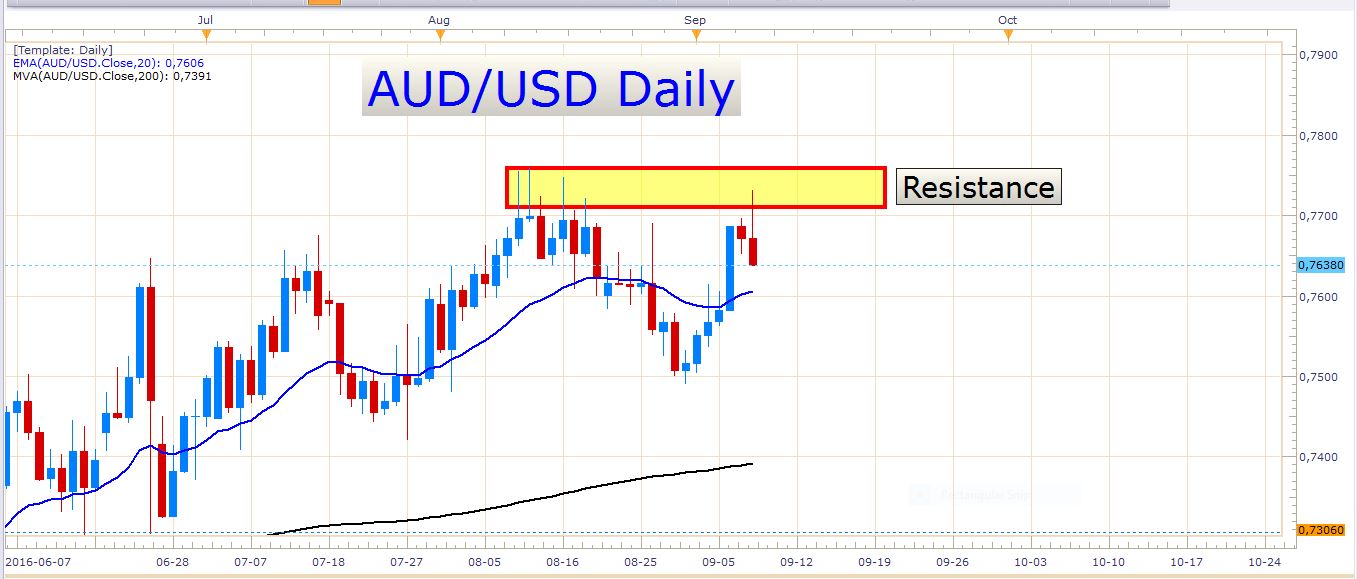
What a day for the Aussie bears! The AUD/USD traded aggressively higher early in the day, only to reverse sharply and close about 90 pips from the daily high. Since Tuesday the technical picture has not been very rosy for traders holding short positions. As mentioned above, the pair traded aggressively higher on Tuesday, ripping through the 20-day exponential moving average. The major resistance zone in the region of 0.77500 proved to be rock solid, however, and the pair failed miserably in its attempt to conquer it. Let’s look at a few charts:
AUD/USD Daily Chart
As you can see, there were quite a few daily bars rejecting from this resistance level recently, including today’s engulfing candle. Of course, we can’t say that the exchange rate will necessarily move lower from here, but one thing is certain – this is a powerful area of resistance. Bullish market players might be able to overcome this resistance, but it will definitely require a lot of energy to do so.
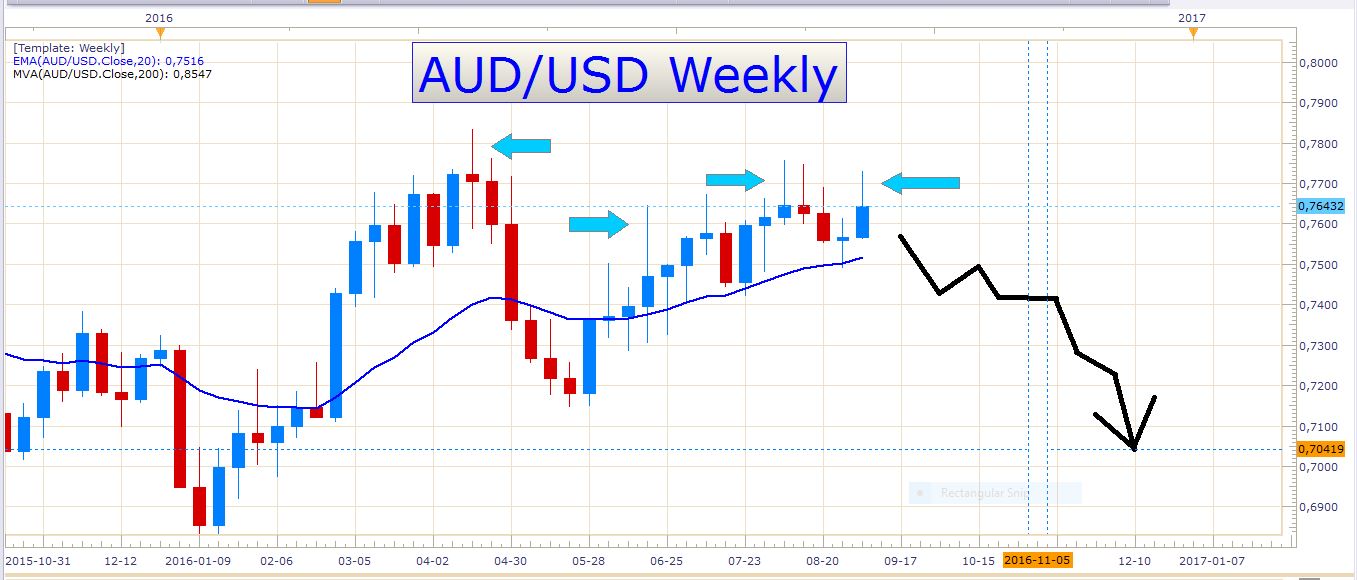
At the moment my bias is still bearish, but I have to say, I would be more comfortable if the price declined some more to trade below the 20-day EMA. I wouldn’t be surprised if the pair continued to trade relatively sideways for a couple of days. If you look at the daily chart you can clearly see that the pair has been trading very sideways for several weeks already. When we look a weekly chart, the many wicks to the topside compel us to consider the bearish outlook for this pair. Let’s look at a weekly chart:
AUD/USD Weekly Chart
When we see a series of upward wicks like we see here, it tells us that a layer of resistance is forming that might be difficult to infiltrate. Many times when this kind of setup is encountered, the price tends to move in the direction of the ‘path of least resistance’. In this case, it seems to be south.
USD/CAD
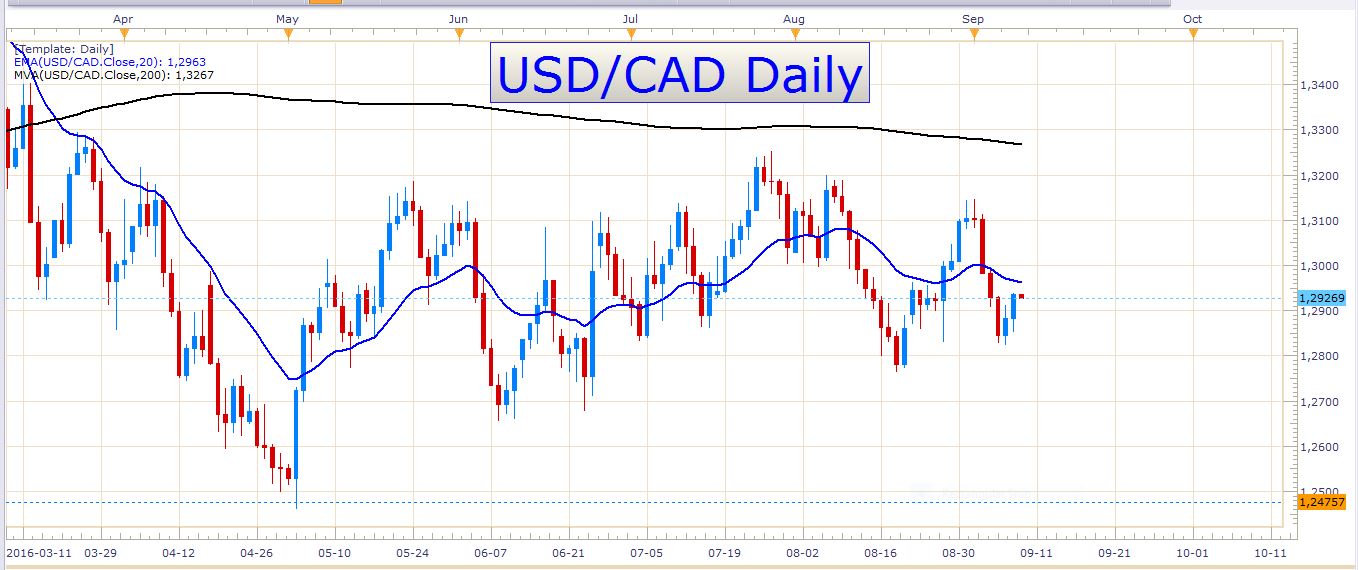
Despite the bounce in the oil price, the Canadian dollar gave back some ground to the Greenback today. The US dollar performed quite well today, and it looks like investors are not going to get rid of all their ‘Bucks’ right now. The US dollar is doing a good job of holding on to support, and the only major currency that gained against it today was the Euro. Tomorrow we have some important employment data out of Canada which could spark some volatility in Canadian dollar pairs. The release is at 12:30 GMT. Let’s look at a daily chart of the USD/CAD:
USD/CAD Daily Chart
I posted some short trade setups on this pair a few days ago. I will not post it again lest I bore you. The entry that was triggered is sitting on a handsome profit, and the downside still looks like the more probable market direction at the moment. If we see oil prices rise some more, and the US dollar losing a bit of ground, the effect could be a splendid break lower on this pair.
GBP/USD
This pair has failed at resistance in the last two days. Perhaps the pair will continue to trade in this large 570 pip range for some while. There has been some loading into long positions lately, and I would not be surprised if the pair broke the upper bound of this range sometime in the near future.
EUR/USD
This pair is also range bound, and with today’s pin bar candle that was formed, the price could possibly trade a bit lower in the next few days.
Economic data
We don’t have a very heavy day tomorrow in terms of economic data. As mentioned above, we have Canadian employment numbers at 12:30 GMT. In the early morning hours, the Chinese are releasing some CPI numbers. There are also some UK trade balance numbers later in the day, as well as the Baker Hughes US oil rig count which could have an effect on the USD/CAD.
Have an excellent trading day!
- Check out our free forex signals
- Follow the top economic events on FX Leaders economic calendar
- Trade better, discover more Forex Trading Strategies
- Open a FREE Trading Account


