After Monday’s Weak Performance, The Buck Is Back With a Vengeance.
Many major currency pairs are still technically stuck in ranges, like the EUR/USD, GBP/USD, USD/JPY, and the USD/CHF. There are some major pairs to be excited about, however. As you might have noticed, the AUD/USD is one of my favorite pairs at the moment. I have written about this pair numerously in the last couple of weeks. I have also suggested some trade setups which have panned out some decent profits so far. What differentiates the AUD/USD, and the USD/CAD from the other major pairs at the moment, is that today these two pairs have breached some important swing points on the daily charts. Let’s look at my favorite pair, the AUD/USD, first:
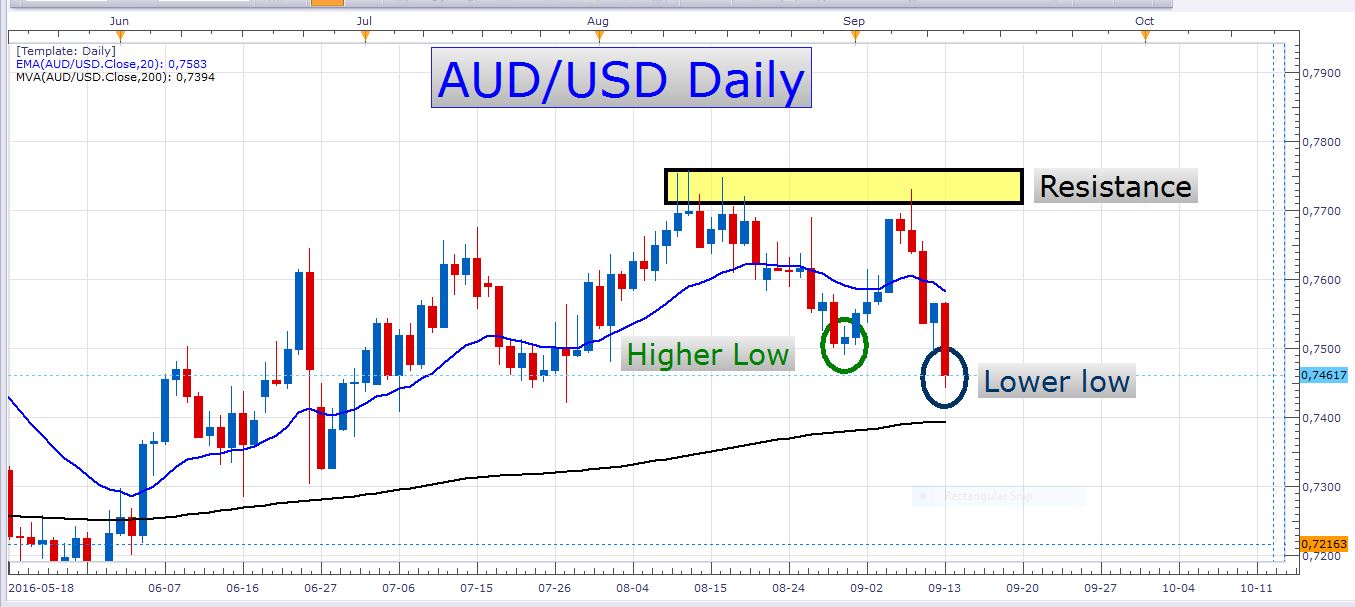
AUD/USD Daily Chart
To the bears, this is a very encouraging picture. This lower low that was formed today, will definitely not go unnoticed by institutional market players. This is the first notable lower low on the daily time frame since the low that was set on the 24th of May earlier this year. The price is now trading firmly below the 20-day exponential moving average (the blue moving average), which also confirms the bearish bias on this pair. As you can see in the chart above, the price is fast approaching the 200-day moving average (the black moving average). Something that also appeals to my bearish bias, is the couple of large red daily candles that were recently printed, which includes today and Friday's candles. This is what we call determined, impulsive selling. Let’s look at an hourly chart:
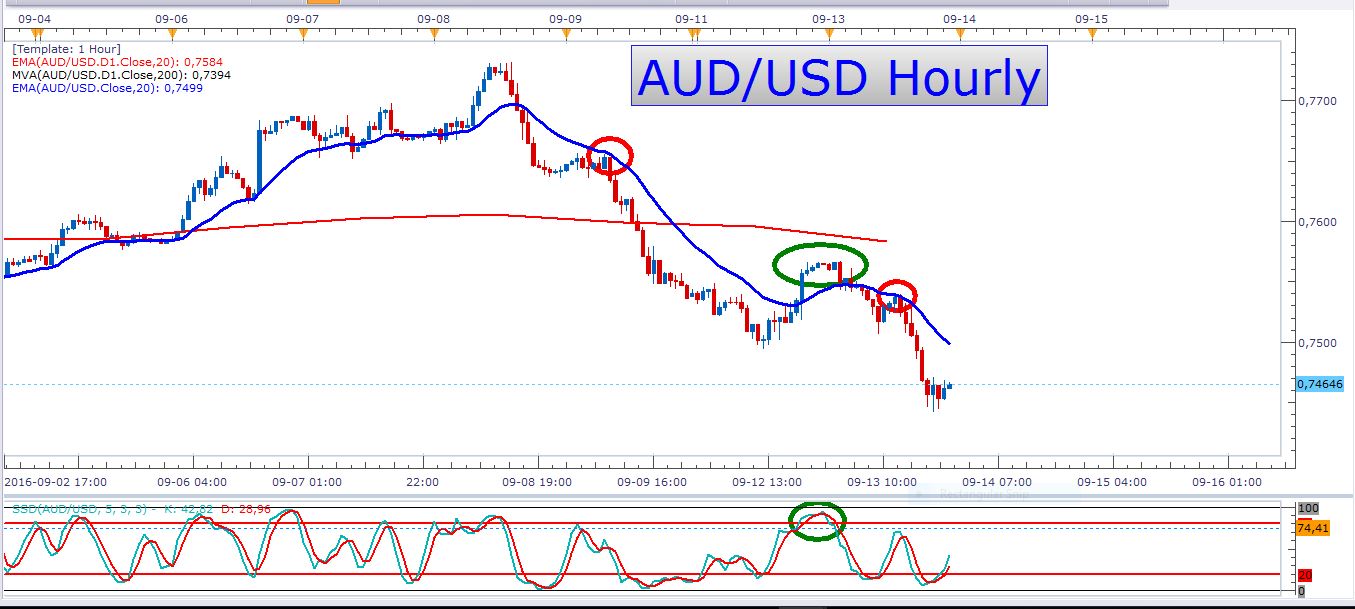
AUD/USD Hourly Chart
On the chart above, the red circles indicate places where the price traded up to the 20 exponential moving average or came very close to it. I generally like to trade retracements that pull back to the 20 EMA. This gives me an edge over the market because many times this is where the pullback becomes exhausted in a strong trend. Just look at the very neat entries that could have been taken at the 20 EMA. The oscillating indicator that you see at the bottom of the chart is what we call slow stochastics. Here we see another great way of entering short in an established downtrend. Look at the green circles on the chart above. When the stochastic indicator moved above the 80 level, this was where the price quickly became exhausted. Traders who sold the pair at these levels achieved pretty neat entries. I like these type of entries because it allows you to use a tight stop loss, and aim for a large target.
Perhaps there might be some great entries to be taken on the AUD/USD in the week that lies ahead. Just remember that on the larger daily timeframe, the recent move south looks like it might pull back sometime soon. I would wait for pullbacks to either the 20 EMA (hourly data source) or the 20 EMA on a 4-hour chart. Perhaps we might also get a superb entry by using the slow stochastics indicator like in the chart above.
USD/CAD
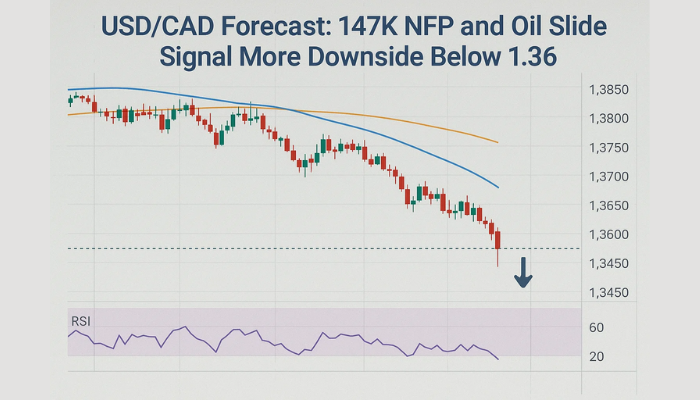
The other pair I’m interested in is the USD/CAD. Let’s look at a daily chart:
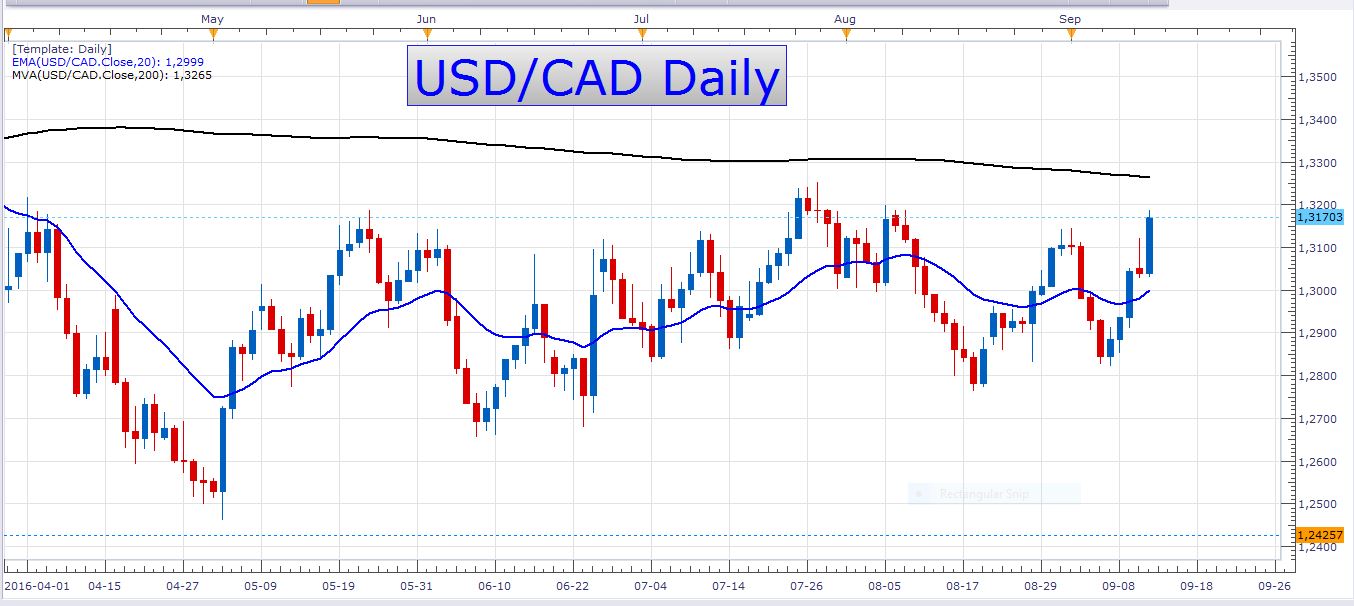
USD/CAD Daily Chart
Here we can see that the price is currently pushing against important resistance levels. It makes me wonder if we might see this resistance level fold sometime soon. Just look at how this pair has carved out a series of higher lows on this daily chart. The black line that you see on this chart is the 200-day moving average, and the blue moving average is the 20 exponential moving average. Just remember that we are sitting at resistance at the moment and that entering long at these levels could be disastrous. The price is also somewhat overbought which makes it difficult to capture some pips by buying into this pair at the time. I would like to wait and observe how the pair reacts to these levels before I enter a trade. Today’s bounce was very impressive and impulsive. What I like about the long picture is that today a new high was been formed. This might open up the way to the 200-day moving average. This moving average and the current resistance levels are basically at the same price level. These levels could perhaps be difficult to overcome at first, but if we get a break through them, it could mean that perhaps a new uptrend is on the horizon.
GBP/USD
This pair fell today after we had some disappointing CPI numbers out of the UK. The pair is stuck in a range, so it really isn’t clear what to expect of it over the near term.
Economic data
Tomorrow we have labor market data out of the UK which could be a market mover, as well as US crude oil inventories numbers which could, of course, move the Canadian dollar which is very sensitive to oil price fluctuations.
Happy trading!
- Check out our free forex signals
- Follow the top economic events on FX Leaders economic calendar
- Trade better, discover more Forex Trading Strategies
- Open a FREE Trading Account