US Dollar Boosted By Strong Inflation Data, British Pound Down By 240 Pips On Friday
Although the Federal Reserve is not expected to raise their interest rates this week, they might want to prepare the markets for a rate hike in December. Of course, we can’t completely rule out the possibility of a hike on Wednesday. According to the September FED Fund futures, there is a 20% chance of a rate hike this week. What the markets will be focussing on at this week’s meeting, is to see how hawkish the FED will be, and when the next rate hike could be expected.
On Friday we had some encouraging CPI data out of the United States which boosted the Greenback. It also looks like market players have started to pre-position themselves for next week’s FOMC meeting by loading into some long US dollar exposure. The British pound was the great loser on Friday, with a magnificent 240 pip loss against the US dollar. Besides the US dollar strength on Friday, there were also some Brexit headlines which involve adverse consequences for the region, and consequently, the pound.This combination of dollar strength and pound weakness caused this great decline in the GBP/USD. Let’s look at a few charts.
GBP/USD
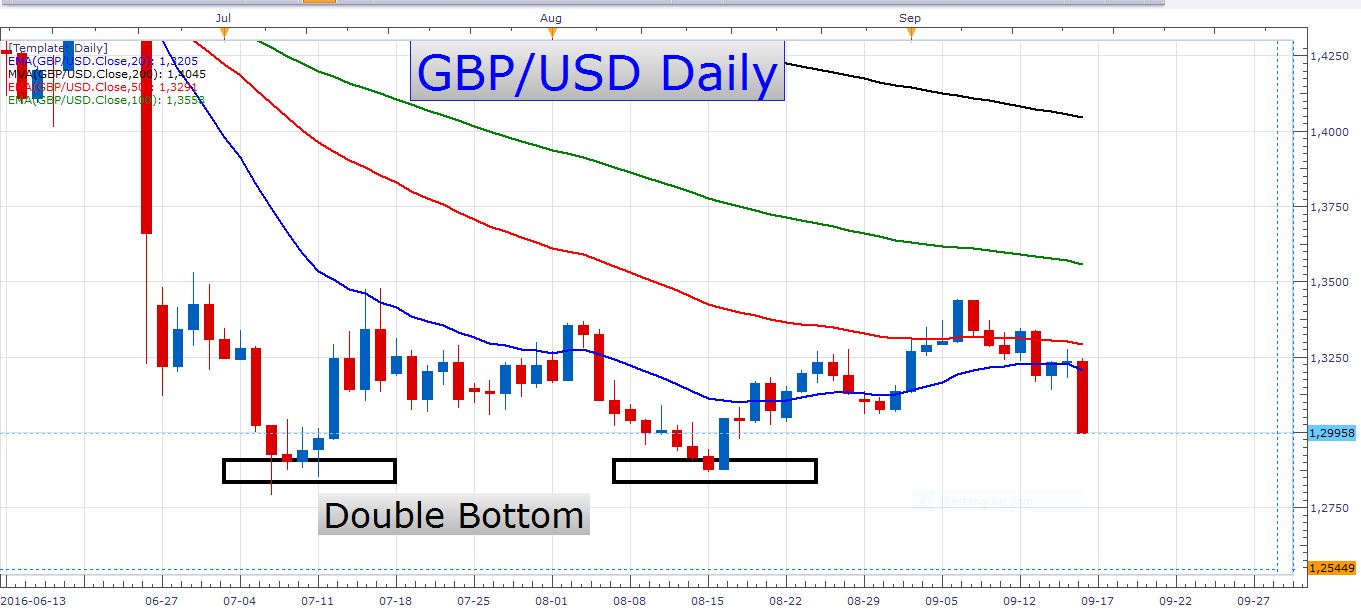
GBP/USD Daily Chart
What an impressive decline! It looks like the pair could reach the yearly lows soon if this momentum continues.
For those of you who like intraday trading, let’s look at a 5-minute chart:
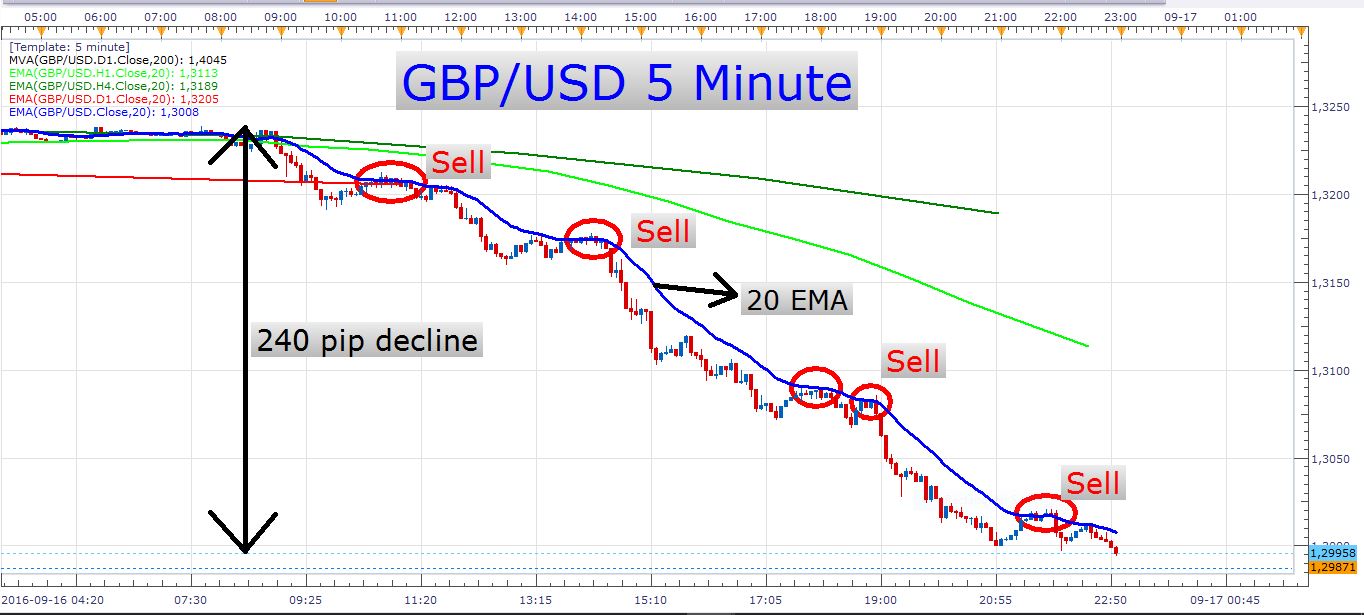
GBP/USD 5 Minute Chart
In this strong, non-volatile decline, traders could basically have entered short positions at any time and made some money. However, it is still amazing how the price was continually resisted by the 20 exponential moving average. Just look at how many times during the course of the trading day the price rejected off of the 20 EMA. There were numerous opportunities throughout the day to sell this pair at pullbacks to the 20 EMA. I wouldn’t use a 5 to 10 pip stop loss on this pair, but even if you traded with such a small stop loss, and waited for the price to retrace to the 20 EMA, you would have profited on basically every trade you took in this example. Also, notice how you could have targeted many more pips than the size of your stop loss.
Just to give you a bit of perspective, let’s look at this same decline on an hourly chart:
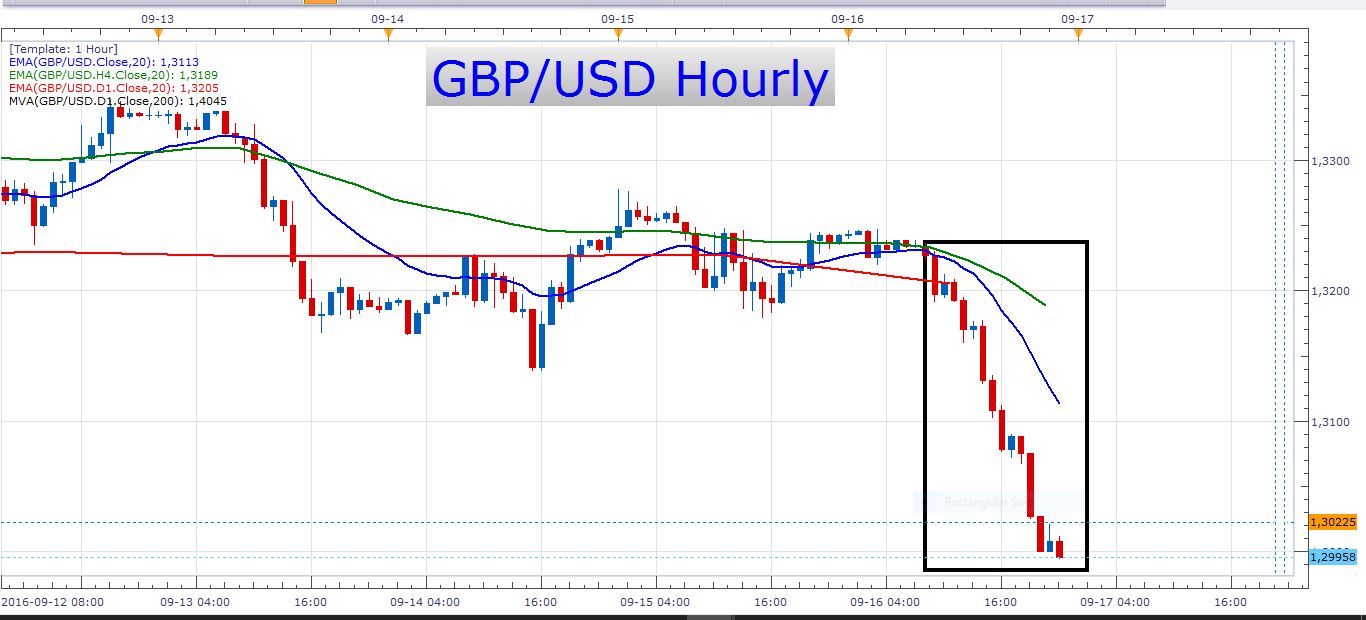
GBP/USD Hourly Chart
Very aggressive, isn’t it? If you would have waited for large pullbacks to, for example, the 20 EMA on an hourly chart, you wouldn’t have found any to trade. The 20 EMA is the blue moving average in the chart above.
Perhaps we’ll see some follow through of the strong selling on this pair this week. I really like the extreme retail sentiment on this pair. At the moment there are 2.9 traders long for every trader that is short. A reading above 2 is considered extreme. Retail sentiment is used as a contrarian indicator, which means that the price is likely to decline further as long as this reading remains extreme.
So how can we trade this pair tomorrow? Friday’s decline was pretty severe, and at the moment oscillating indicators are giving us oversold readings, especially on shorter timeframes. This makes me cautious of entering a short position at the current price. I would prefer to wait for a reasonable pullback to take place first, and then see if we get some impulsive selling again. If we get a pullback to the 20 EMA on an hourly chart, for example, I would keep an eye on how the price reacts to it. If I see some renewed selling pressure step in, I will initiate new short positions. Look at this chart:
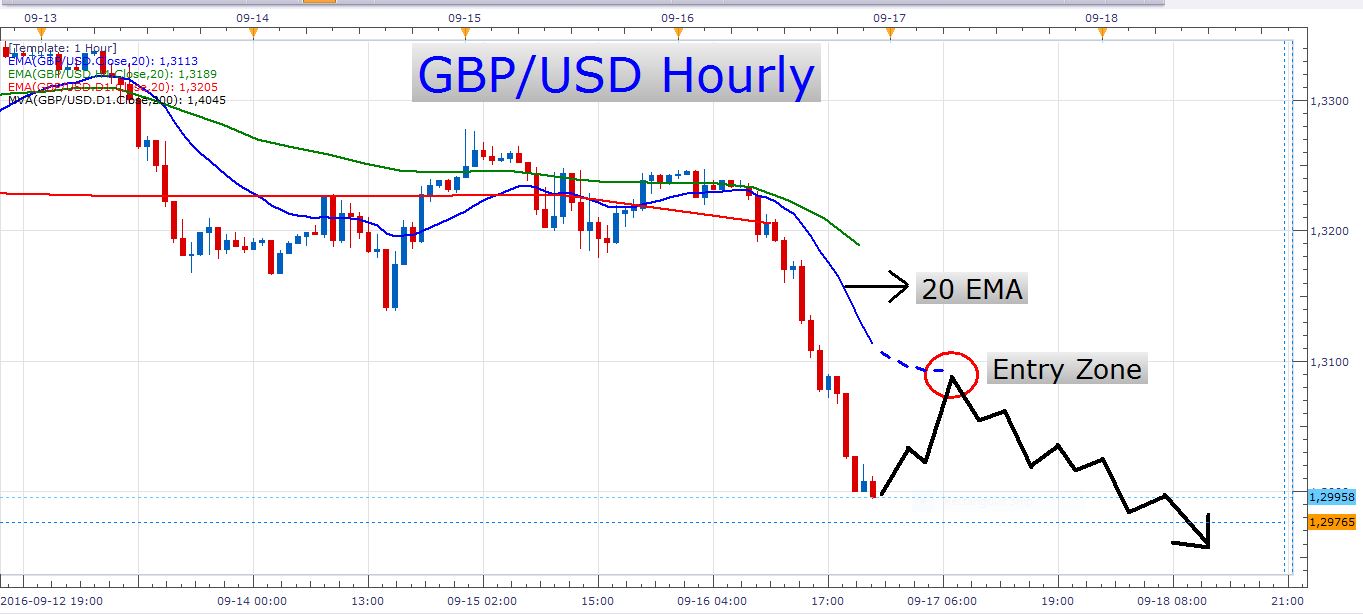
GBP/USD Hourly Chart
EUR/USD
The Euro also lost a lot of ground against the dollar on Friday and closed the day right at the 200-day moving average. If we see some further dollar strength this week, the pair could trade through this very important moving average soon. This pair has not been one of the easiest to trade lately, the reason being that it’s been trading in a range for quite a while. If you have experience in range trading, I would say play the range until it breaks. Otherwise, there might be some scope for trading intraday bursts of volatility.
AUD/USD
I am still in the short trades I opened a while ago. These trades are doing pretty well, and it is likely that the pair will trade lower in the next week or two. I would like to see a breach of the 200-day moving average soon, as this will greatly establish my bearish bias on the pair.
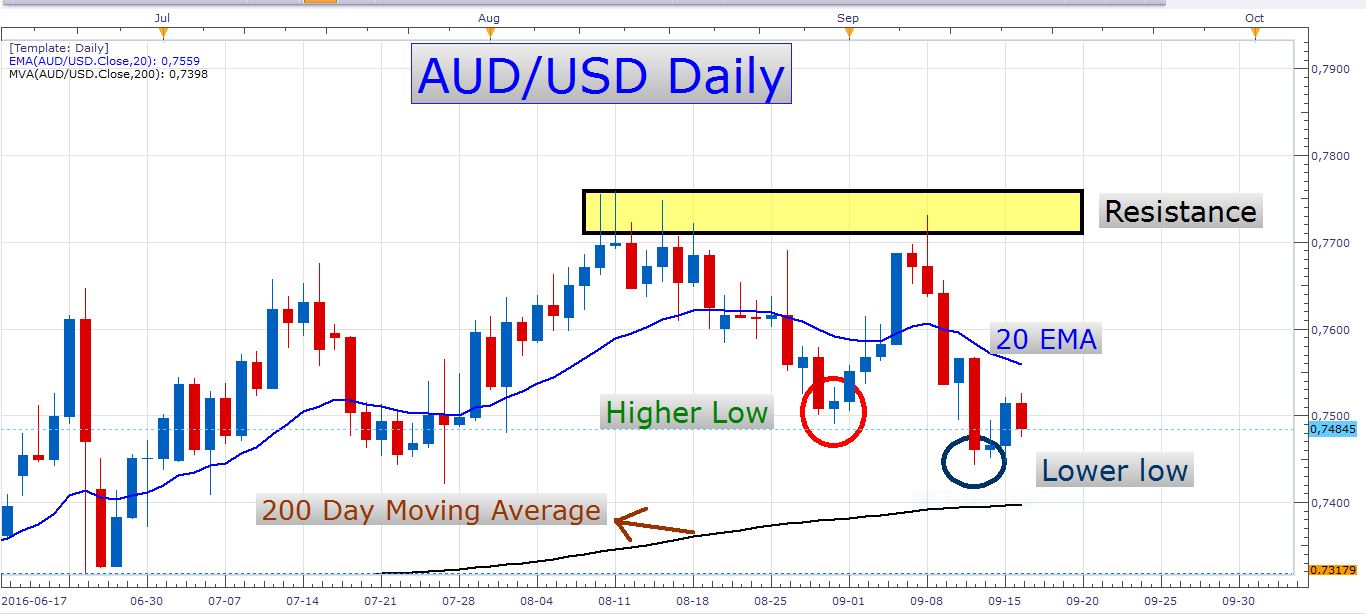
AUD/USD Daily Chart
USD/CAD
This pair is trading at an important resistance zone at the moment. Although it might be a difficult zone to overcome, the FOMC meeting this week, and Janet Yellen’s speech might be just the right fundamental catalysts to drive the exchange rate through this zone. The 200-day moving average is right at this resistance zone and greatly adds to the importance of it. Look at the following chart:
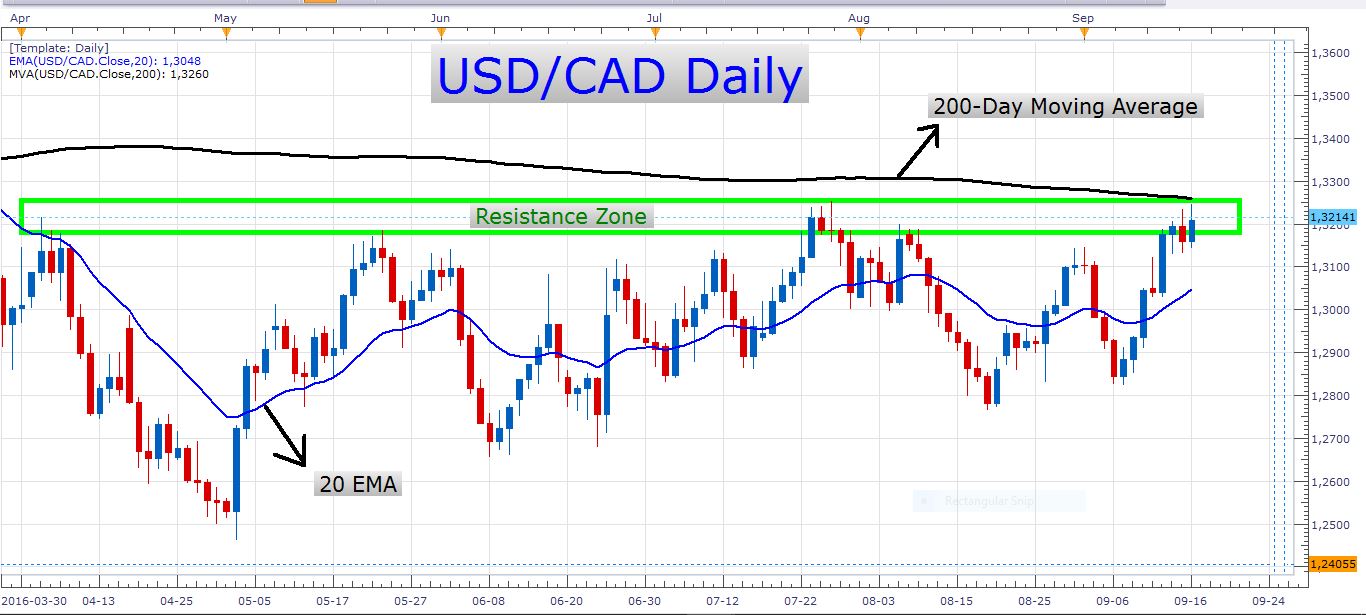
USD/CAD Daily Chart
News and events
Tomorrow is a holiday in Japan, and with Tokyo being one of the world’s major financial centres, this might have an effect on currency trading activity.
There aren’t any economic data releases out tomorrow worth mentioning, and this might also weigh on trading activity and market liquidity.
Have a great trading day!
- Check out our free forex signals
- Follow the top economic events on FX Leaders economic calendar
- Trade better, discover more Forex Trading Strategies
- Open a FREE Trading Account
- Read our latest reviews on: Avatrade, Exness, HFM and XM
Related Articles

Sidebar rates
Related Posts
