The British Pound is in the Crossfire Again – Cable is Slipping Through Multi-Week Range Support
Until today, the only major pair I was excited about was the USD/JPY. However, the GBP/USD offered some pretty good selling opportunities today, and traders who held short positions over the weekend were handsomely rewarded when the pair gapped lower to start out the week.
The Brexit could soon become a reality with Theresa May’s pledge to trigger Article 50 of the Treaty of Lisbon around the end of March 2017. This would mean that the severance process between the UK and the EU could be completed by mid-2019. At the moment the UK economy seems to be doing fine amidst all the political and financial uncertainty, but the Brexit could easily shuffle things around for the British economy. Let’s look some charts:
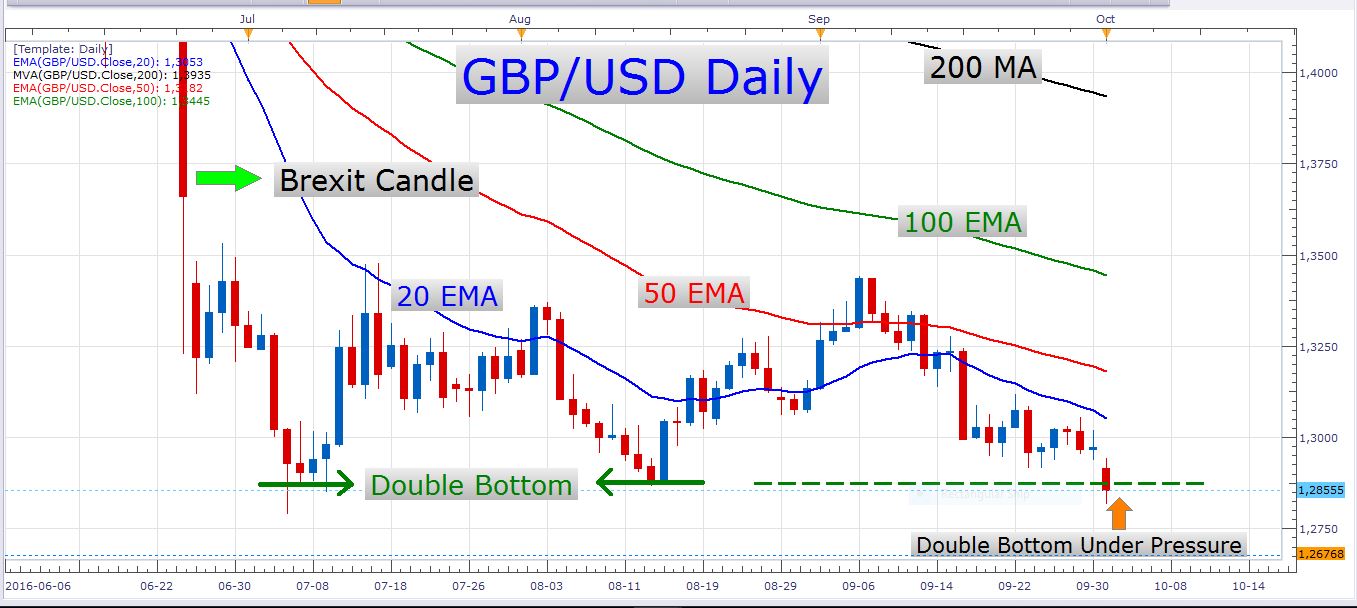
GBP/USD Daily Chart
Since the recent swing high that occurred on the 6th of September, there has been some pretty determined short selling of this pair. In just a couple of days, the pair dropped about 600 pips. At one stage it seemed like the bullish market players were going to drive the pair through the top of the current range and trigger the preceding double bottom. At the moment, however, the price is far below any point of resistance and it looks like the pair could print a fresh yearly low soon. Let’s look at a 5-minute chart:
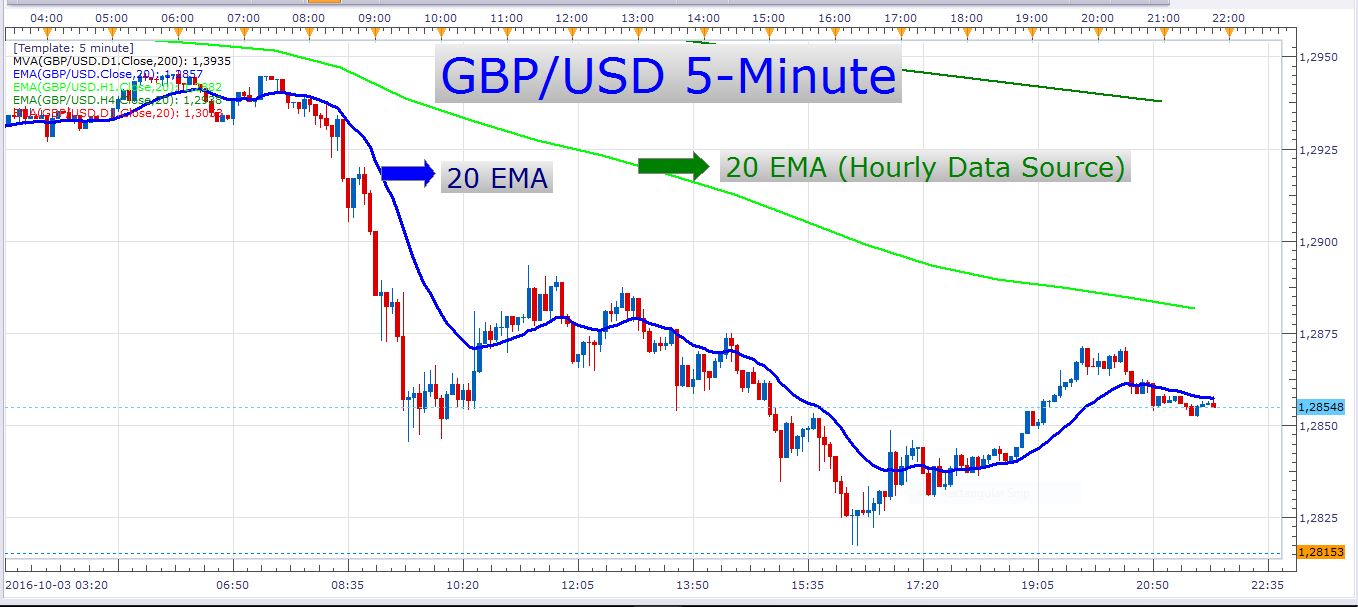
GBP/USD 5-Minute Chart
As you can see, there was some really impulsive selling of this pair today. I opened a short position at about where the blue arrow is situated which marks the 20-EMA. I am still holding on to this position to see if we’ll maybe get some follow through of today’s bearish momentum tomorrow. The reason I used the 5-minute chart to time my entry, is because I didn’t want to wait for a meaningful retracement (e.g. a pullback to the 20 EMA on an hourly chart) when I saw the sudden acceleration of the decline in the exchange rate. Let’s look at a chart that I posted a few days ago:
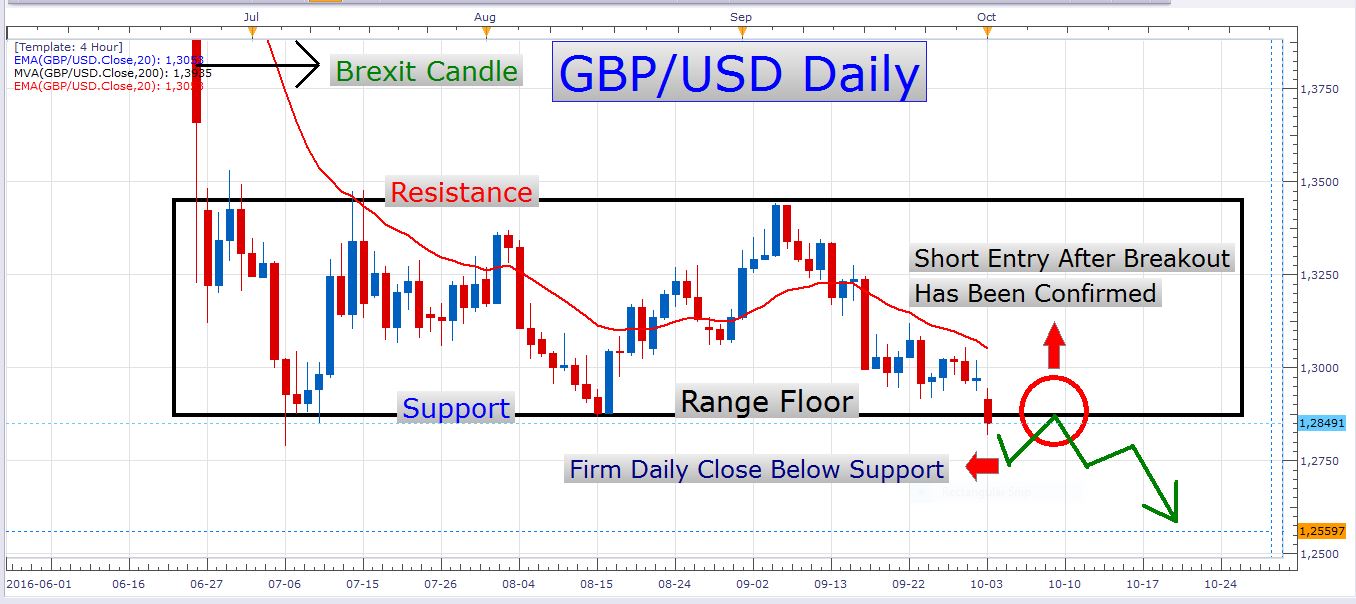
GBP/USD Daily Chart
I’m posting this chart again for a very good reason – the probability of this trade setup coming into play soon has greatly increased after today’s aggressive selling. Today’s close is the lowest daily close on this pair in 31 years! The bullish market players are clearly on the backfoot, and if we saw the price decline further over the next few days, a lot of long stops would be triggered which would just add fuel to the breakout. Let’s look a 30-minute chart:
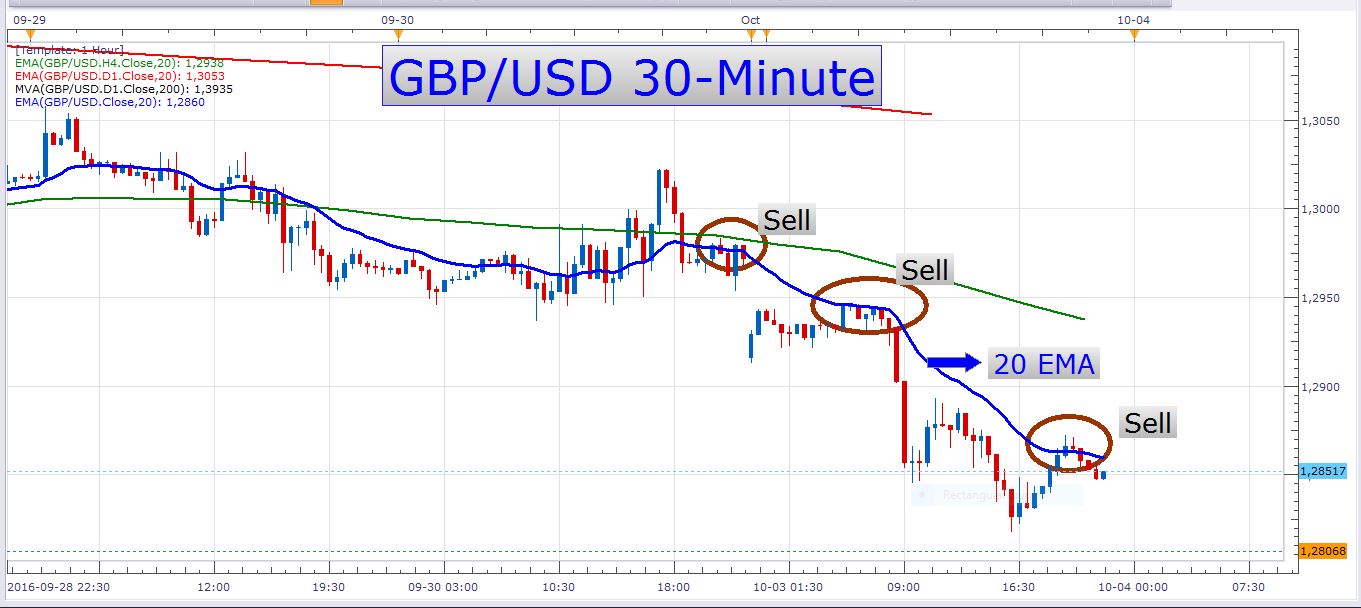
GBP/USD 30-Minute Chart
Notice how the 20-EMA frequently resisted the price retracements today. When strong impulsive selling takes place like it did today, the price corrections will often not reach the 20-EMA on the higher timeframes like the hourly and 4-hourly. This is when it can be very profitable to switch to the next smaller timeframe, like in this case the 30-minute chart. Let’s look at an hourly chart to further clarify what I mean:
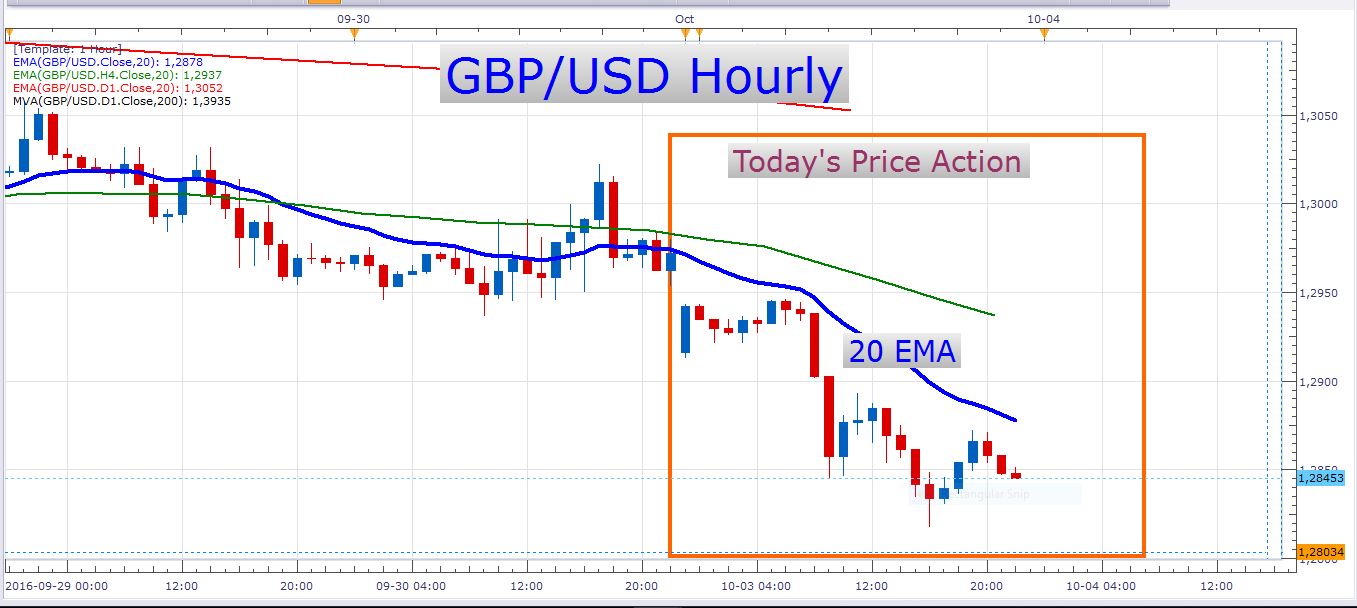
GBP/USD Hourly Chart
Here you can see, that on a day like today, you would have missed all your short entries on this pair of you had waited for the retracements to reach the 20 EMA (the blue moving average on the chart above), whereas on the 30-minute timeframe you would have caught at least one short entry, and that a perfect one.
There is some important economic data out of the UK tomorrow – the Construction PMI numbers which will hit the wires at 08:30 GMT. If we get a disappointing number tomorrow it could add to the current weakness of the pound.
Besides the splendid action on the GBP/USD (and the other pound pairs) today, the rest of the major pairs have not been very active. I suppose the holiday in Germany played an important role in causing the quiet markets. I expect to see more volatility tomorrow with Germany being online again. Remember that tomorrow is another holiday in China. I don’t think it will impact the currency market too much, though.
The main economic data event for tomorrow is the Reserve Bank of Australia’s interest rate decision and rate statement which will take place at 03:30 GMT. The RBA is widely expected to keep their rate unchanged at 1.5%. Perhaps the interest rate decision itself will not be the great potential market mover, but rather the rate statement which accompanies it. This is of course, provided that there isn't a surprise rate hike, neither a rate cut.
Best of luck with your trading!
- Check out our free forex signals
- Follow the top economic events on FX Leaders economic calendar
- Trade better, discover more Forex Trading Strategies
- Open a FREE Trading Account


