After a Very Quiet Day in the Currency Market, the Euro and Swiss Franc are Still on the Back Foot. Commodity FX and the Greenback Remain Strong
Volatility was quite subdued in the FX market today. Most of the day was consumed by a lot of meaningless sideways chop. Although the US dollar gave back some of its recent gains today, the bull flag pattern on the US Dollar index indicates that a further gain might be probable. Let’s look at a chart of this index:
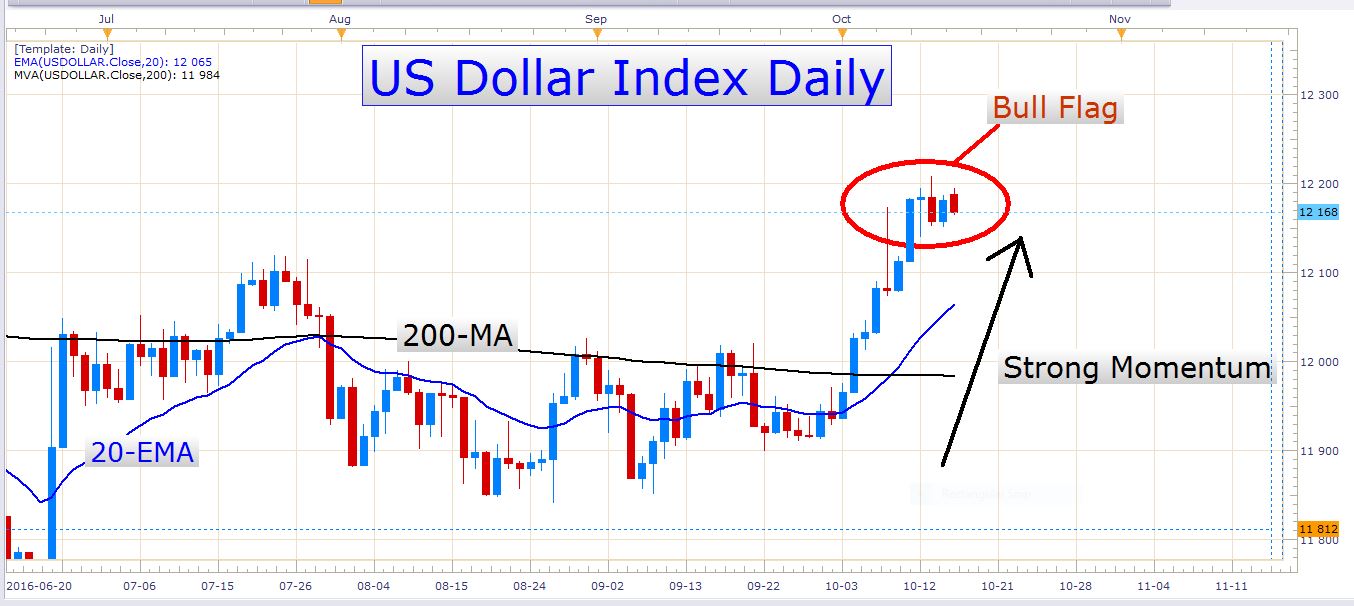
US Dollar Index Daily Chart
Here you can see just how strong the dollar’s performance has been in the last two and a half weeks. Remember that this index is an equally weighted composite of four major currencies namely the Australian dollar, the pound, the Euro, and the Japanese Yen against the US dollar. A quick glance at this index gives you a good idea of the general strength of the US dollar.
The USA is the only country out of the G10 countries who are tightening the reins at the moment, and although a lot of this has been priced into the US dollar already, it is worth keeping this in mind. The situation in the US is totally different than in Japan and Europe, for example. In these regions, the central banks are actively stimulating their economies, and are not even thinking of raising their interest rates anytime soon. This is quite a remarkable contrast. The US have already raised their interest rate once (in December 2015). The FED often tell us that further rate hikes will be gradual and also data dependent. This has been a hurdle for the US dollar, but through it all, the dollar has posted quite an impressive performance despite this type of FED rhetoric.
EUR/USD
The Euro managed to gain a few pips against the US dollar today. This was really just a weak bounce, however, and I would not at all be surprised if the pair continued its decline in the days ahead. Let’s look at a daily chart of this pair:
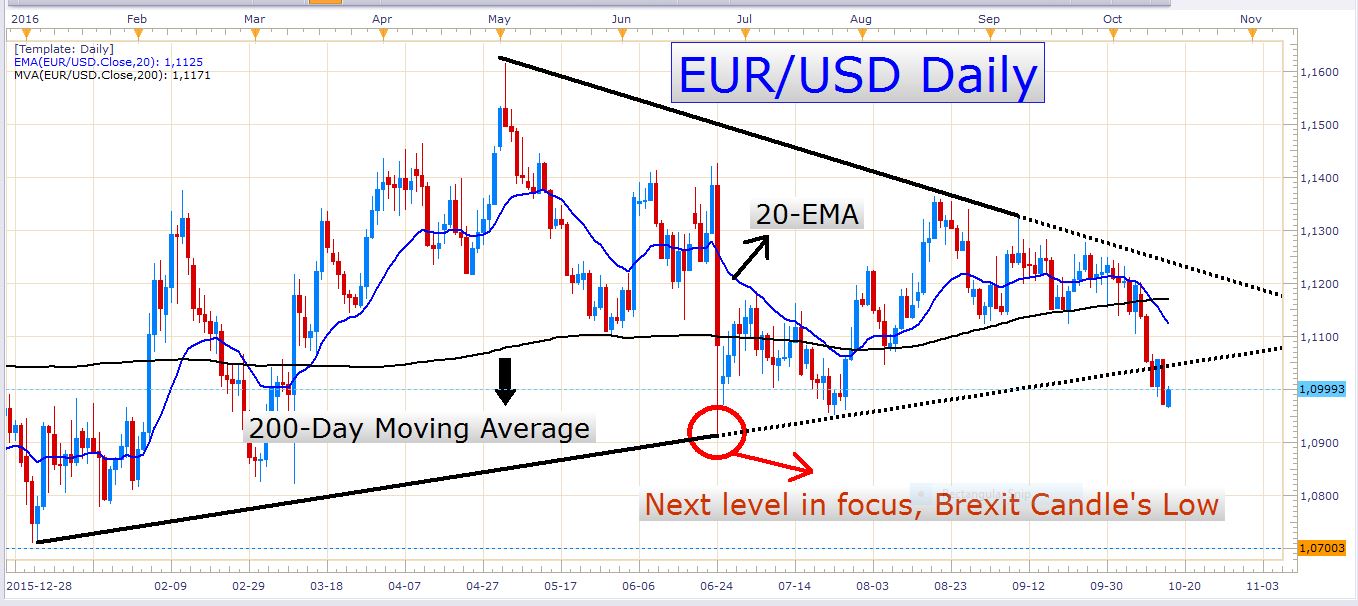
EUR/USD Daily Chart
The uncertainty concerning the Deutsche Bank and the massive $14 billion fine it could face is still hanging over the European region. It has been rumored that the bank could even face additional fines for money laundering which could possibly jeopardize its solvency and threaten its existence. If a European banking crisis should arise in the near future, this would weigh heavily on the Euro which could drive down the EUR/USD exchange rate aggressively. Remember that the US dollar generally performs well in an environment where uncertainty and fear grip investors’ hearts. The combination of dollar strength and Euro weakness could push down the EUR/USD aggressively.
AUD/USD
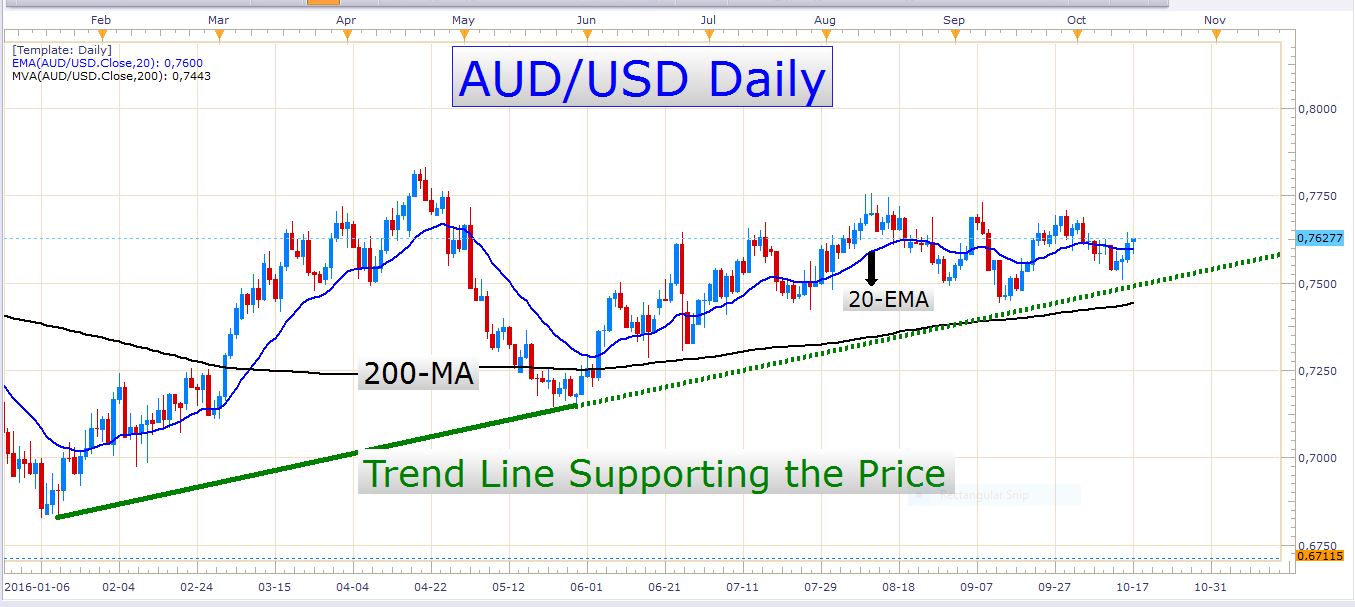
AUD/USD Daily Chart
While we haven’t seen the formation of new swing highs on the Aussie in the last 48 trading days, the pair has done a pretty good job of staying buoyant amidst the tremendous dollar strength we’ve recently encountered.
In a few hours’ time, the RBA meeting minutes will be released which could have a notable effect on the pair. If the RBA’s meeting reflects an upbeat tone about the Australian economy, the Australian dollar could gain even more against the US dollar. The new RBA governor, Dr. Philip Lowe will deliver a speech in a few minutes’ time which I suspect could be bullish for the Australian dollar.
Let’s not forget that there are still many economic risks surrounding the global economy. The Australian economy is very vulnerable to an economic slowdown because of their dependence on commodity exports such as iron ore, gold, black coal, brown coal, uranium, and many other minerals. If China’s economy had to suffer a recession, for example, the Australian economy would probably follow the same path which would really hurt the Australian dollar.
USD/CHF
USD/CHF Daily Chart
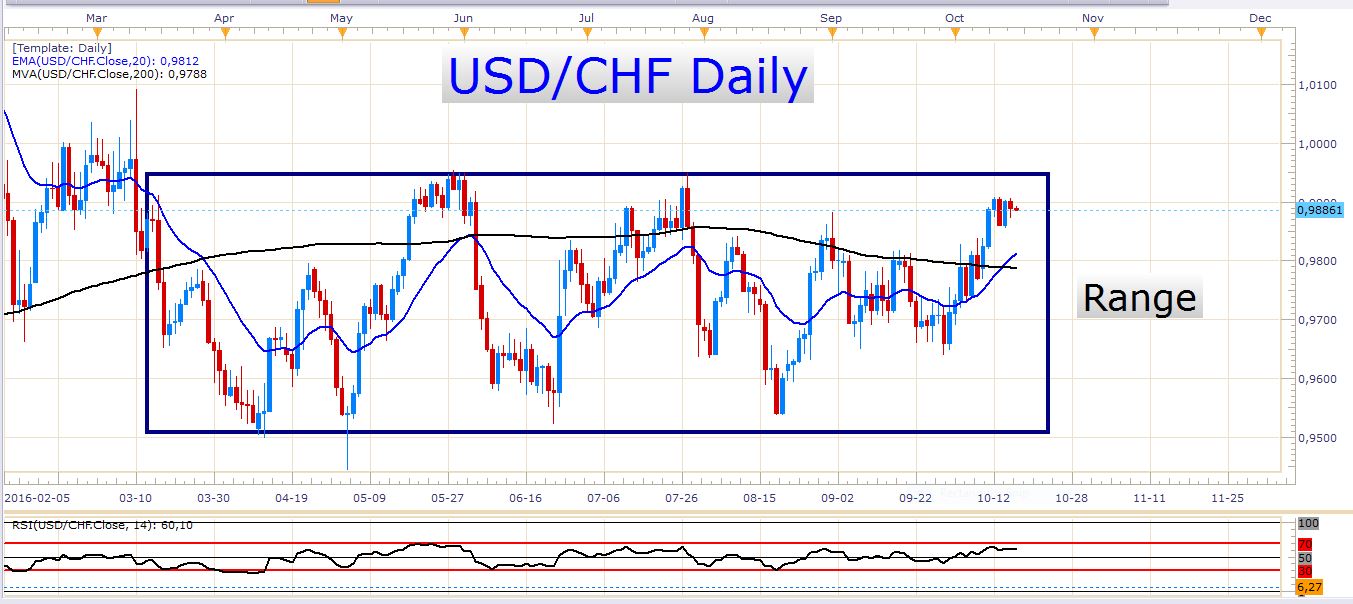
This pair has definitely not been suitable for trend traders lately. This is the type of setup range traders make money from. The dollar is pushing the pair up into resistance again, and perhaps there might be a good opportunity to short the pair again. The current price doesn’t look like a bad level to enter short, but I would personally like to see a good reversal signal like a juicy pinbar candle, even if it were on a smaller timeframe than the daily timeframe. The pair could, of course, break out higher from here, but at the moment it looks like this might require more buying strength than which the bullish market players currently possess.
Traders who would like to sell this pair close to the current market price (0.98845) can do so with a stop loss of about 100 pips, and a target of about 300 pips.
USD/CAD
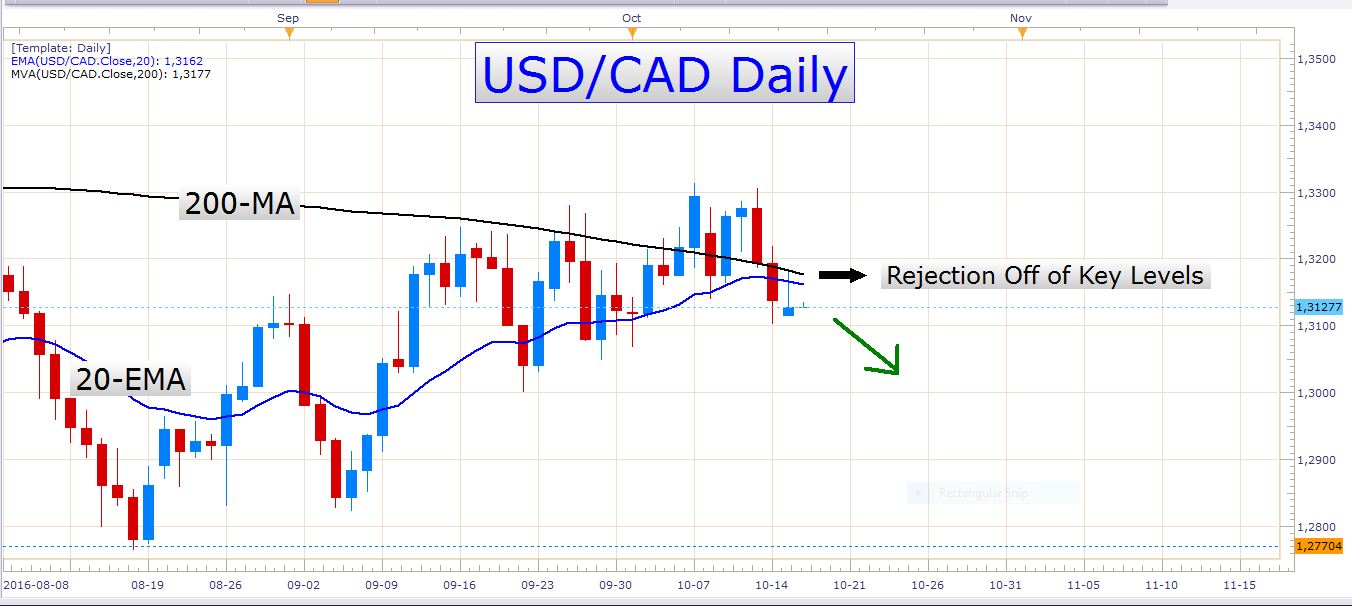
USD/CAD Daily Chart
I really like the way this candle rejected off the 200-day moving average and the 20-day exponential moving average on the same day. I would be surprised if we don't see more downside on this pair over the next few days.
Important events to watch tomorrow:
-
RBA Meeting Minutes at 00:30 GMT
-
UK CPI numbers at 08:30 GMT
-
US Core CPI numbers at 12:30 GMT
Good luck with your trading!
- Check out our free forex signals
- Follow the top economic events on FX Leaders economic calendar
- Trade better, discover more Forex Trading Strategies
- Open a FREE Trading Account
- Read our latest reviews on: Avatrade, Exness, HFM and XM
Related Articles

Sidebar rates
Related Posts
