The US Dollar is Giving Back Some Gains Despite Today’s Good Manufacturing Data; the Swiss Franc Chopped up the Buck Today
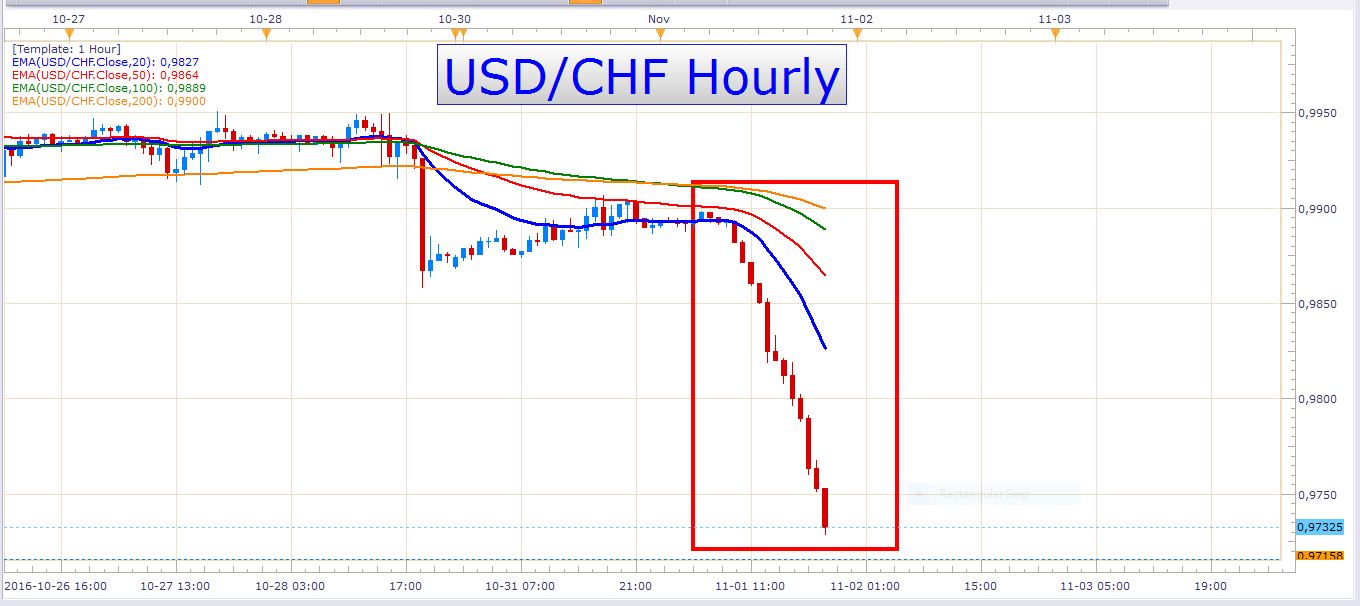
The Swiss Franc posted a really impressive performance today. The selloff in the USD/CHF was with determination, and without any notable pullbacks. Look at this hourly chart:
USD/CHF Hourly Chart
Amazing, isn’t it? We don’t see a 150 pip selloff in the USD/CHF every day. On this chart, you can see that the pair printed twelve bearish candles in a row. Now although the US dollar was generally weak today, it doesn’t discount the Swiss Franc’s phenomenal performance.
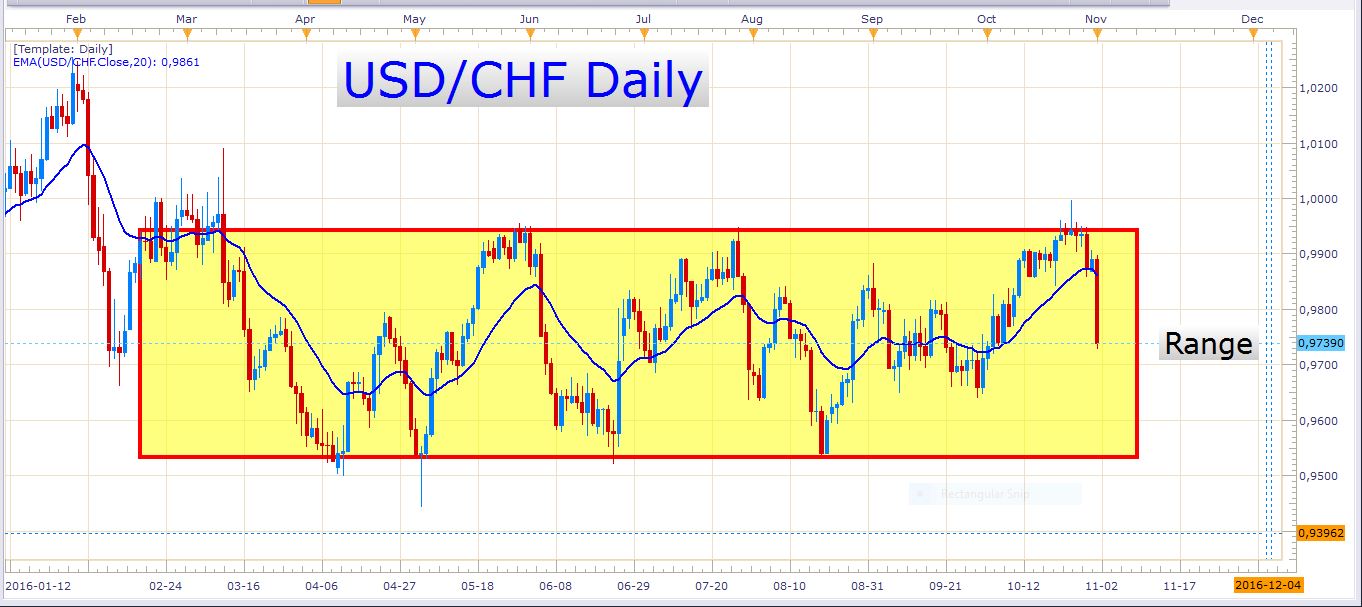
I posted a short (sell) trade idea on this pair last week, but the stop level was unfortunately breached by a mere 14 pips. The same daily candle that breached this stop level formed an even more attractive pinbar candle, and if you were watching this pair you could have pulled the trigger the second time to make a handsome profit. Of course, this wasn’t the last great opportunity in the currency market, and it is always better to look for fresh opportunities rather than fretting about missed or lost trades. Let’s look at a daily chart of the USD/CHF:
USD/CHF Daily Chart
If you perhaps wondered why I called for a short position a few days ago, this chart explains it all. This is a well-defined range that has formed on this pair over the last couple of months. We’ve seen quite a few attempts to break the range’s support and resistance levels, but all were futile.
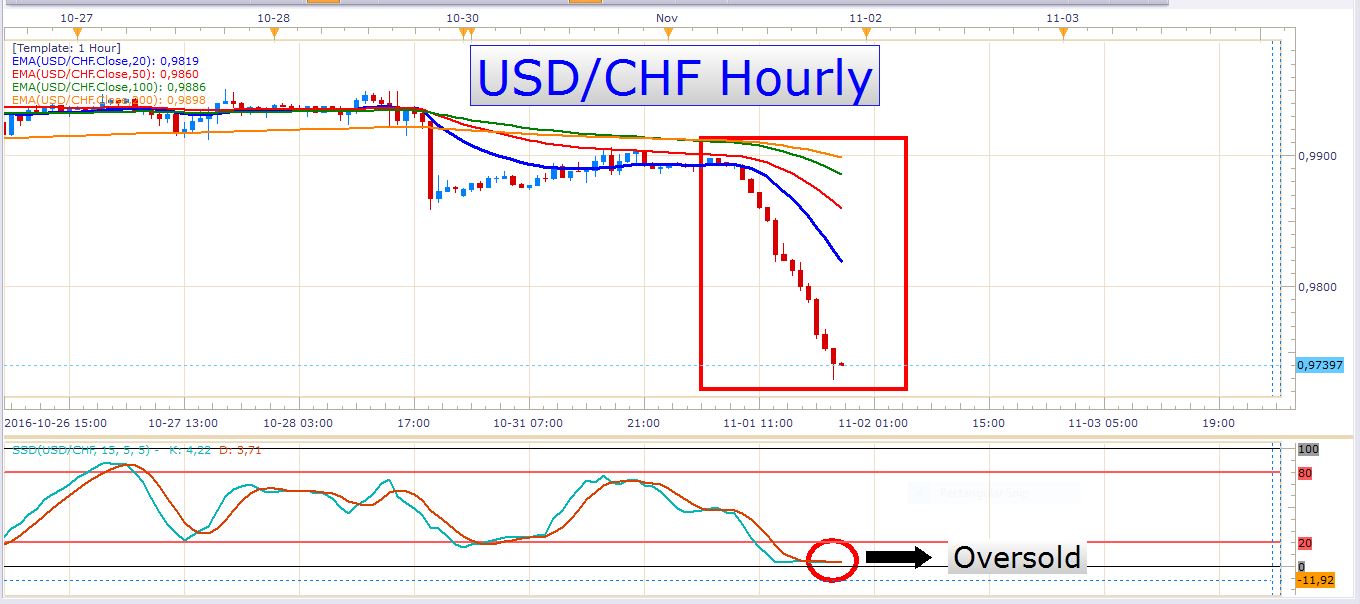
Perhaps you are tempted to initiate short positions on this pair at the current market price. It could possibly be profitable, but it is normally not a good idea to chase the market like that. This was a very aggressive decline, and many times you’ll see a correction of some sort appear when the selling pressure starts to wane. Look at an hourly chart with the slow stochastics indicator added to it:
USD/CHF Hourly (With Slow Stochastics)
This stochastics indicator is a momentum indicator and oscillates between overbought and oversold levels. Here you can see that this indicator is currently giving us a reading that is terribly oversold. Now, the market has a tendency to make a pop many times after a great decline like this, and especially when momentum indicators give us extremely oversold readings. It is almost like a beach ball that is forced under the water and pops out of the water with a great force after it is released. The idea is to wait for better levels to enter at, like for example a pullback to the 20-EMA on an hourly chart. Of course, you can wait for pullbacks on larger time frames, but sometimes it takes a lot of time, especially after an aggressive decline like this has taken place.
Tomorrow evening’s FED interest rate decision and the FOMC statement might spark some volatility across the FX board, but it seems like institutional market participants have a solid bearish bias on the USD/CHF at the moment. I suspect that we’ll see some profit taking on this pair during the next few hours which might lift the pair somewhat. The question is whether the sellers will reload into some more short positions after we get this bounce.
EUR/USD
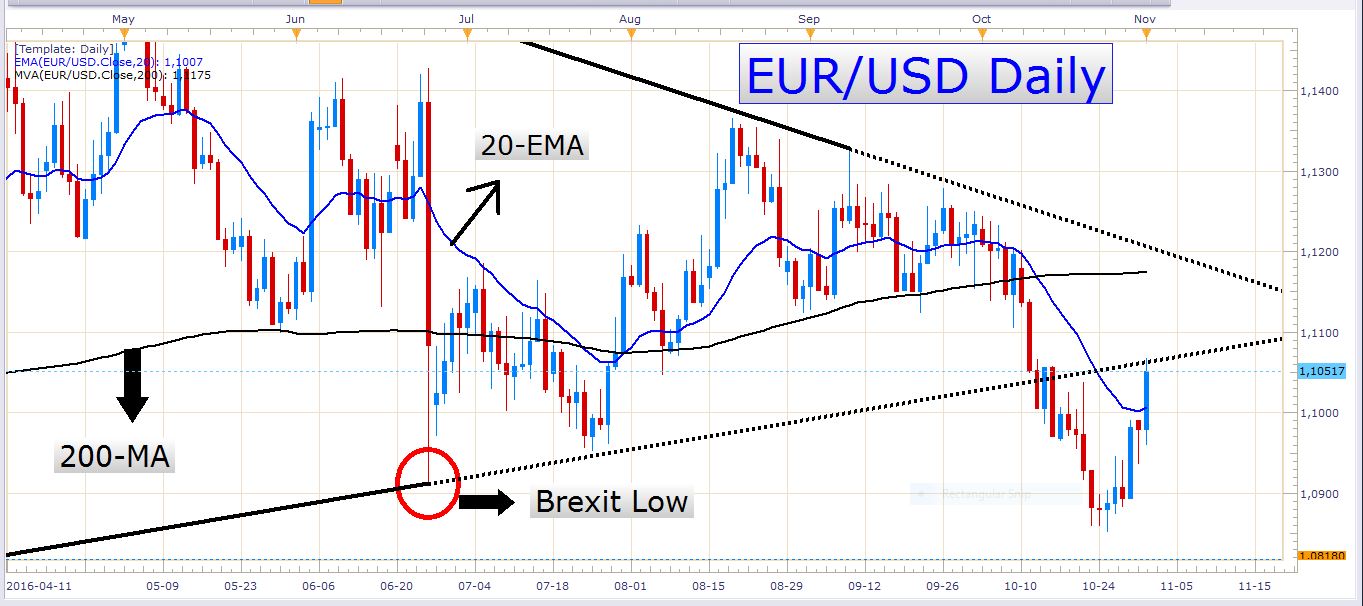
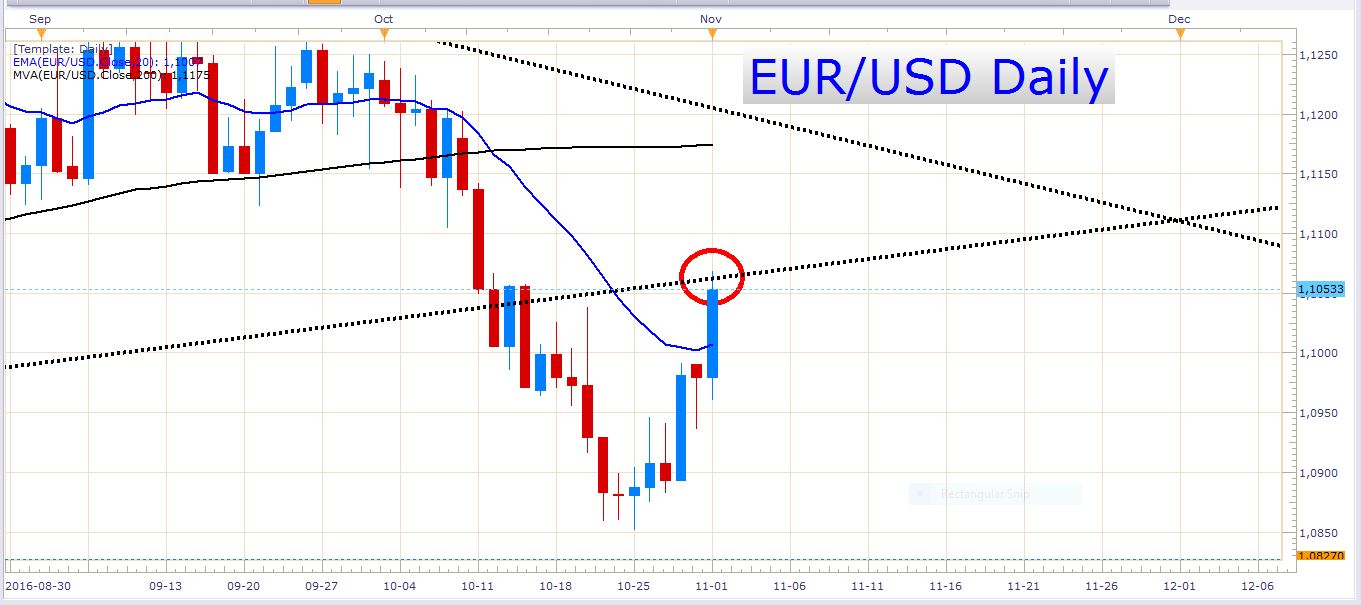
The Euro posted a solid gain against the US dollar today. Look at these daily charts:
EUR/USD Daily Chart
EUR/USD Daily Chart (Enlarged)
Here you can see that the price slammed right into the trend line that formerly acted as support, but was rejected by it. The trading day is not over yet, and we could, of course, get a close above this trend line today, but it is worthy to mention that at the moment this line is acting as resistance. It looks like former support might be turning into new resistance, not only in terms of this trend line but also in terms of other former support zones which could now start to act as new resistance.
USD/JPY
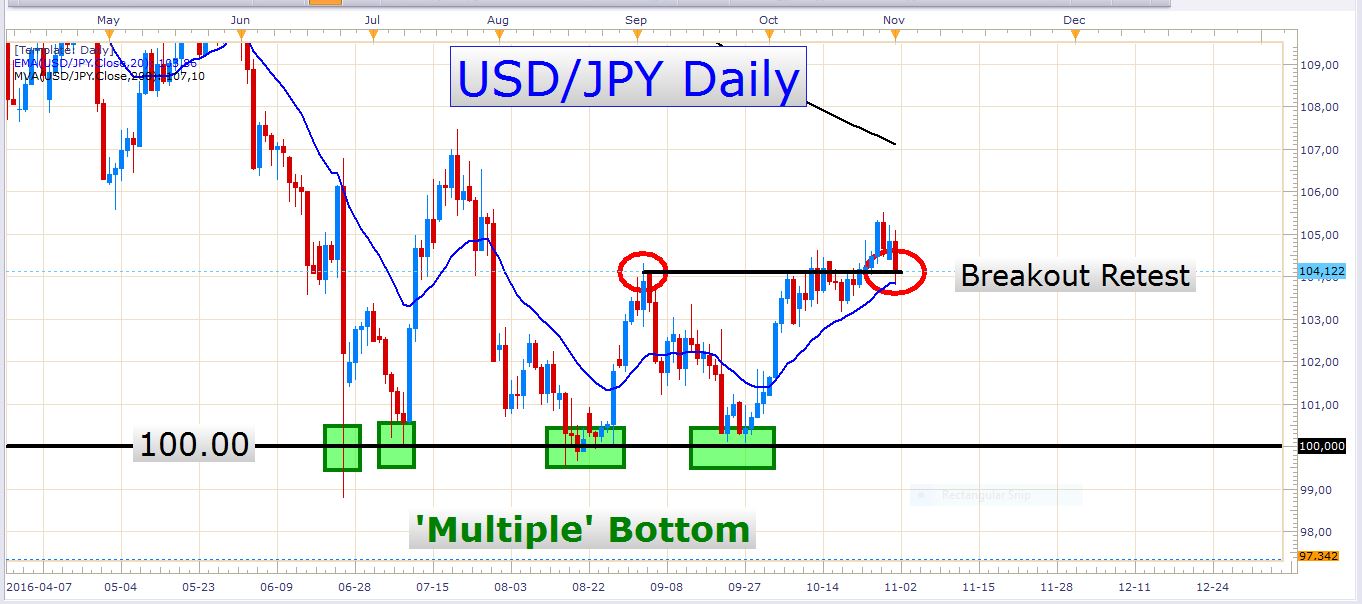
There was a pretty aggressive selloff in this pair today. It lost about 73 pips on the day, and I’m sure many traders were caught by surprise with this sudden decline. Look at this daily chart:
USD/JPY Daily Chart
The current price of this pair is at a level where it’s retesting the former breakout level and might ignite some buying pressure because of that. Experienced traders know that former resistance zones often turn into new support zones, and that is why we could possibly see renewed buying pressure at the current market price.
When we consider today’s sturdy performance of the Japanese yen, the Swiss Franc, and gold, together with equity markets that traded lower, it looks like we could have a bit of risk aversion on our hands. When this happens, investors typically flee to save-haven assets like the Japanese Yen, the Swiss Franc, gold, and other safe assets. In times like these, they also sell riskier assets like for example certain equities, and higher yielding currencies. There are still many global financial risks which threaten investor confidence, and possible risk aversion is something that any trader should be aware of.
Economic data
The most important event tomorrow is undoubtedly the FED interest rate decision and the accompanying FOMC statement. These are both at 18:00 GMT. Besides these, there will be German manufacturing and unemployment numbers at 08:55 GMT and UK construction PMI numbers at 09:30 GMT. The ADP Nonfarm employment change numbers are released at 12:15 GMT. These numbers often give us a good idea of the strength of the very important nonfarm payrolls numbers which are released on Friday. Lastly, we have US crude oil inventory numbers at 14:30 GMT which is particularly important to traders who trade the Canadian dollar because of the high correlation between it and the oil price.
Best of luck, and have a great trading day!


