A Rough Start to the New Week with Large Market Gaps on Many Currency Pairs. The US Dollar is Showing Signs of Life Again, Going into the US Presidential Elections Tomorrow
The Australian dollar performed really well today and managed to gain about 45 pips against a strong US dollar. The Canadian dollar also stood its ground and gained about 34 pips against the Buck.
The European majors were not so fortunate, however. The EUR/USD gapped about 80 pips lower and lost about 100 pips for the day. The British pound’s ascent was stopped in its tracks, and the GBP/USD lost about 115 pips on the day.
Even if we knew what the outcome would be of tomorrow’s election, its effect on the currency market is not easy to gauge. Perhaps there might be a lot of sideways whipsaw-like price action, with a negligible lasting effect at the end of the day, who knows.
When there is a lot of uncertainty in the air, and investors and traders are nervous, we often see irrational moves in the financial markets. This makes trading exceedingly risky if you don’t know what you’re doing, and you don’t have enough self-control. Rookie traders will often chase strong price spikes, and use too much leverage in volatile market conditions. Now you might have heard this many times before, but it certainly is the truth – you need to trade with a great trading plan, and then stick to it. Don’t be tempted to take unplanned, impulsive trades.
Let’s look at some technicals on a few major currency pairs:
EUR/USD
This is the most liquid currency pair on the planet. The EUR/USD failed at an important role reversal level today. Look at this chart that I posted on Thursday (3 November):

EUR/USD Daily Chart (3 November)
I mentioned that there could be a splendid opportunity to sell the pair at the level displayed on the chart. I also used the RSI indicator to gauge the level of exhaustion of the pair. Here is the same chart with the RSI indicator on it:
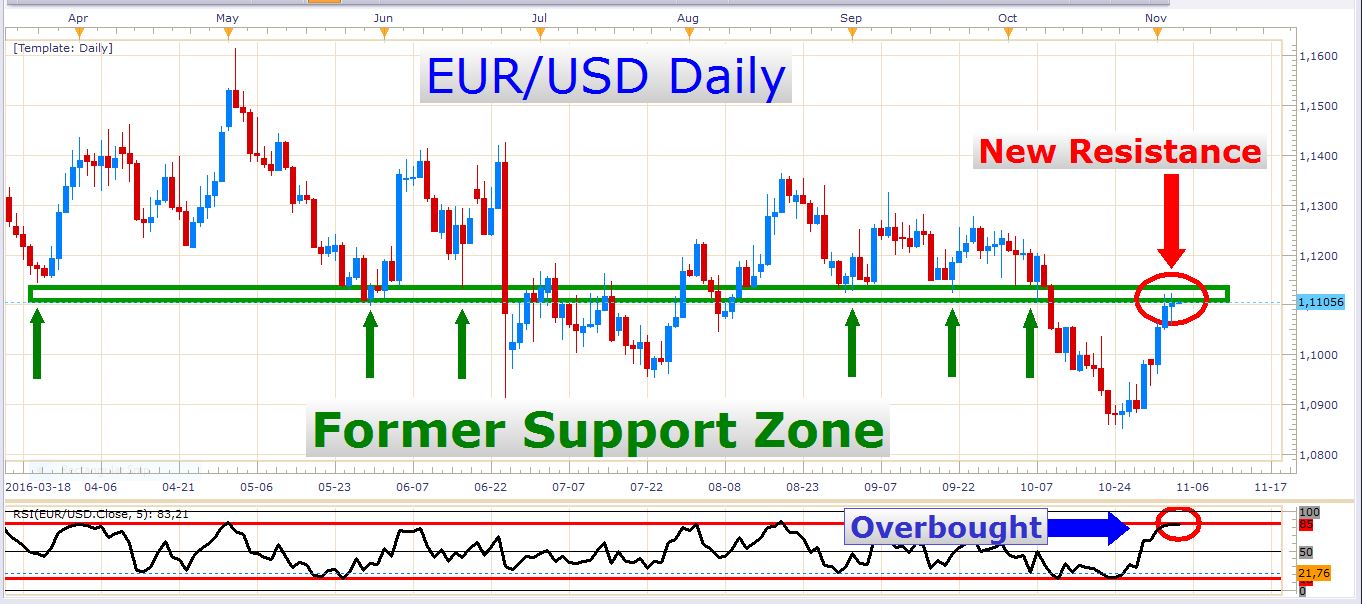
EUR/USD Daily Chart (3 November)
This is a good example of using the confluence of different signals to confirm a good trade. Look at where we are today:
EUR/USD Daily Chart
Here you can see that the RSI indicator has returned from overbought, and the pair traded aggressively lower today. The difference between Friday’s close and today’s close is almost 100 pips. This could have been a great short trade if you utilized the setup.
If we get strong price movements during the next two days, there might be some splendid opportunities to make money out of the momentum. I like trading pullbacks to the 20-EMA on a 5-minute chart on a currency pair that’s moving impulsively in one direction. You might ask why I use such a small timeframe. Well, when a very impulsive, one-sided move occurs on a particular currency pair, traders who normally trade pullbacks to e.g. the 20-EMA on a 4-hour chart, will only get entry signals long after most of the action took place, and they will miss out on a gain of potentially hundreds of pips. Here is an example of trading retracements to the 20-EMA on a 5-minute chart:
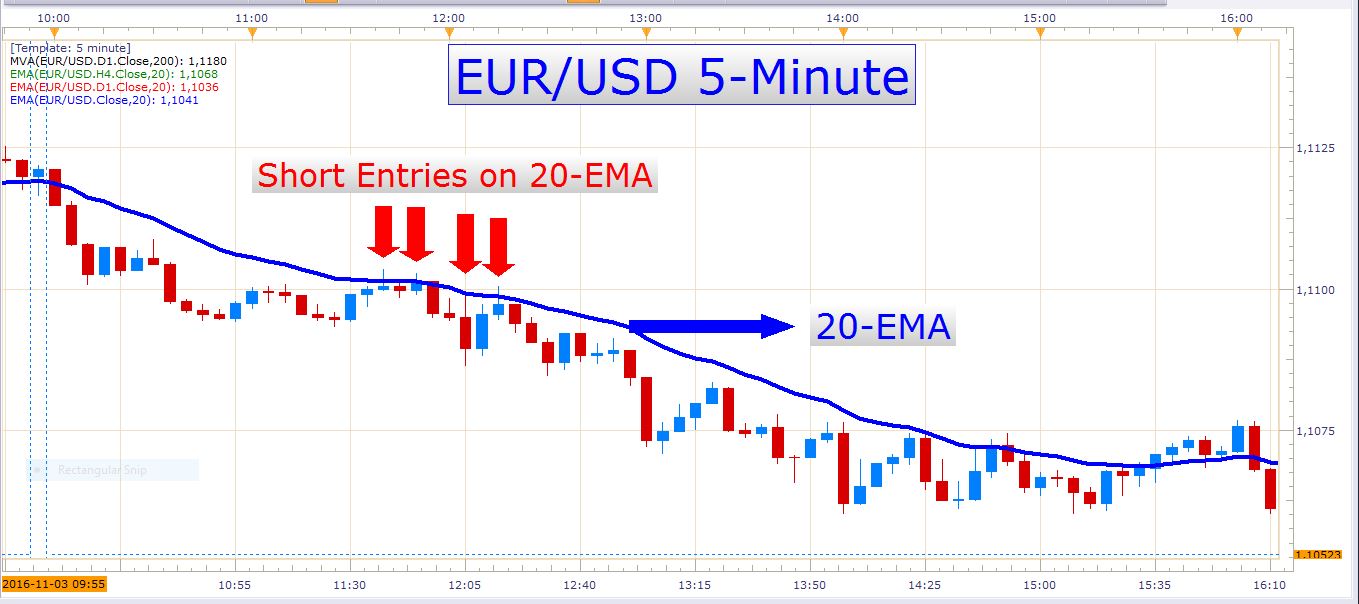
EUR/USD 5-Minute Chart
With a stop loss of about 10 to 15 pips, you could have easily hit a target of 20 to 30 pips – double the amount of your stop loss. Remember to risk only a very small portion of your account on each trade, just like the experienced and professional traders do.
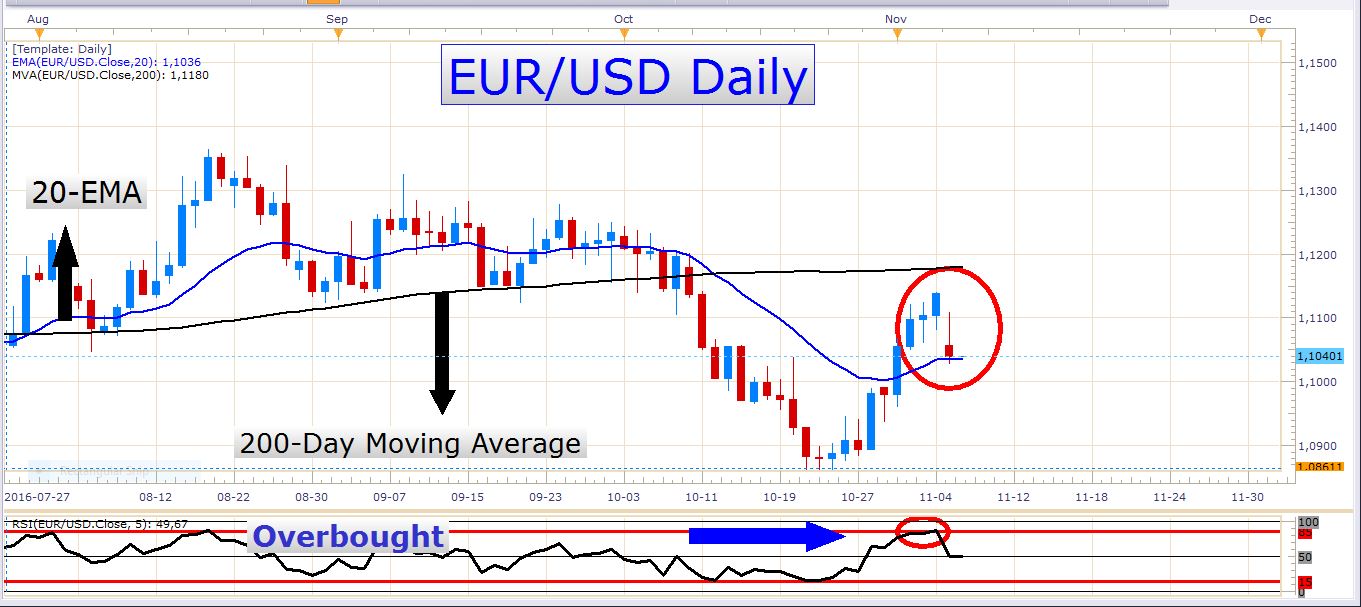
The technical picture on the EUR/USD is not very clear at the moment. We can, however, draw the conclusion that the pair is trading in a large range, and that there might be a lack of solid direction over the next few weeks or even months. Of course, we can’t exclude the possibility of a pickup in volatility in this pair, especially with the elections in the US tomorrow. I just don’t see the pair breaking out of the range that it has been caught in for the last + – 426 trading days, in the next week or two, although it is perfectly possible.
GBP/USD
This pair has broken beautifully above the 20-EMA last week, and perhaps this moving average will turn into new dynamic support for the pair. The bigger picture of the pair reveals that it is still in a downtrend, so just keep that in mind when you decide to engage in long positions. I personally made some good profits on this pair last week by buying into the impulsive rise. Here is a daily chart if the pair:
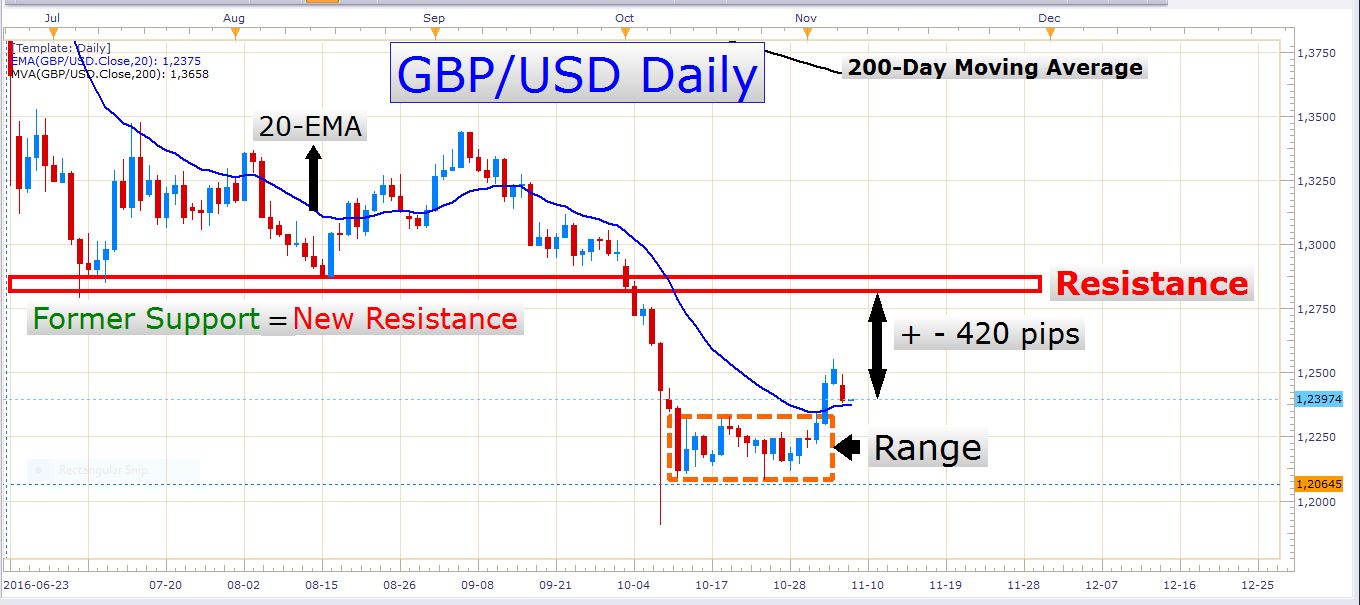
GBP/USD Daily Chart
AUD/USD
Last but not the least, let’s look at the AUD/USD:
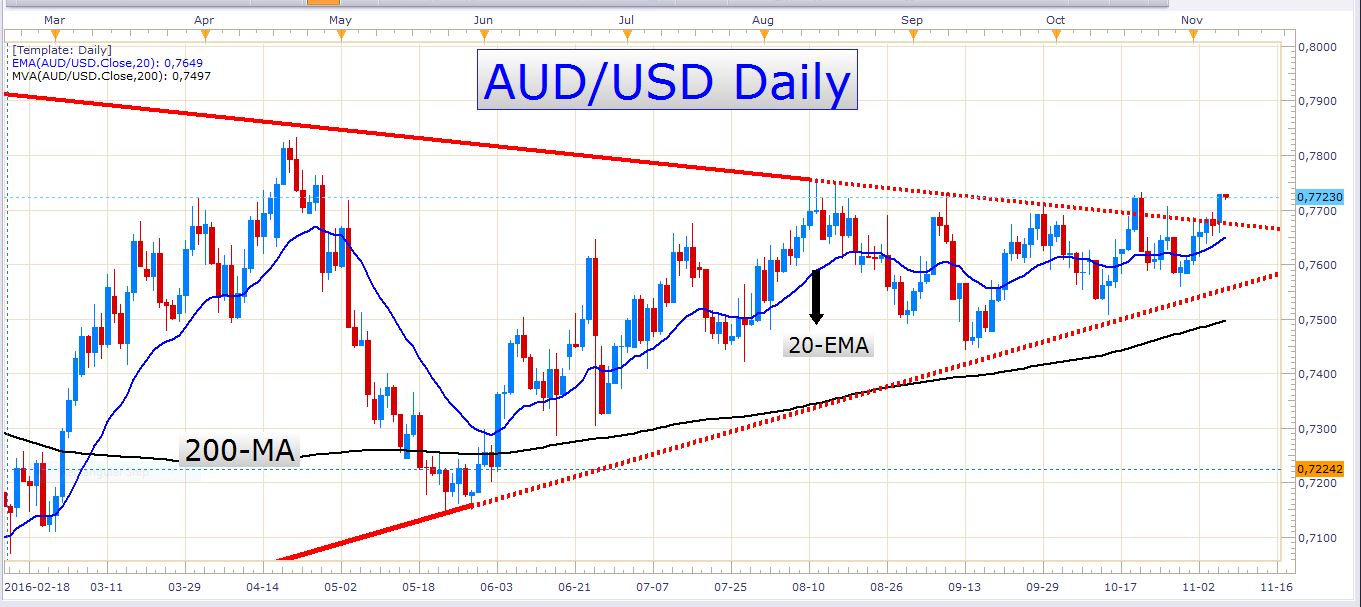
AUD/USD Daily Chart
The Australian dollar performed really well today and advanced against the US dollar which was pretty strong itself. Although I didn’t trade the AUD/USD today, I have short positions on the EUR/AUD which are running beautifully.
It looks like the AUD/USD is breaking out of the wedge in which it has been confined for such a long time. Considering its nifty performance over the last few days, but especially today, I wouldn’t be surprised to see this pair float higher over the next few weeks.
For now, I’m not interested in predicting market direction, but I’m ready to react to whatever happens. Market reactions to events like this election are often overreactions, and irrational behavior can lead to choppy price action. Be careful with your trading over the next few days, and don’t use too much gearing when you trade.
All the best, and good luck!
- Check out our free forex signals
- Follow the top economic events on FX Leaders economic calendar
- Trade better, discover more Forex Trading Strategies
- Open a FREE Trading Account
- Read our latest reviews on: Avatrade, Exness, HFM and XM
Related Articles

Sidebar rates
Related Posts
