Trump Reflation Trade Still Blowing Life into the US Dollar
As expected, the US dollar traded higher today – much higher. The Australian dollar was the only major that didn’t lose ground against the dollar. The Euro, pound, Canadian dollar, Japanese Yen, and the Swiss Franc all surrendered plenty of pips to the US dollar. Let’s look at a few charts:
EUR/USD
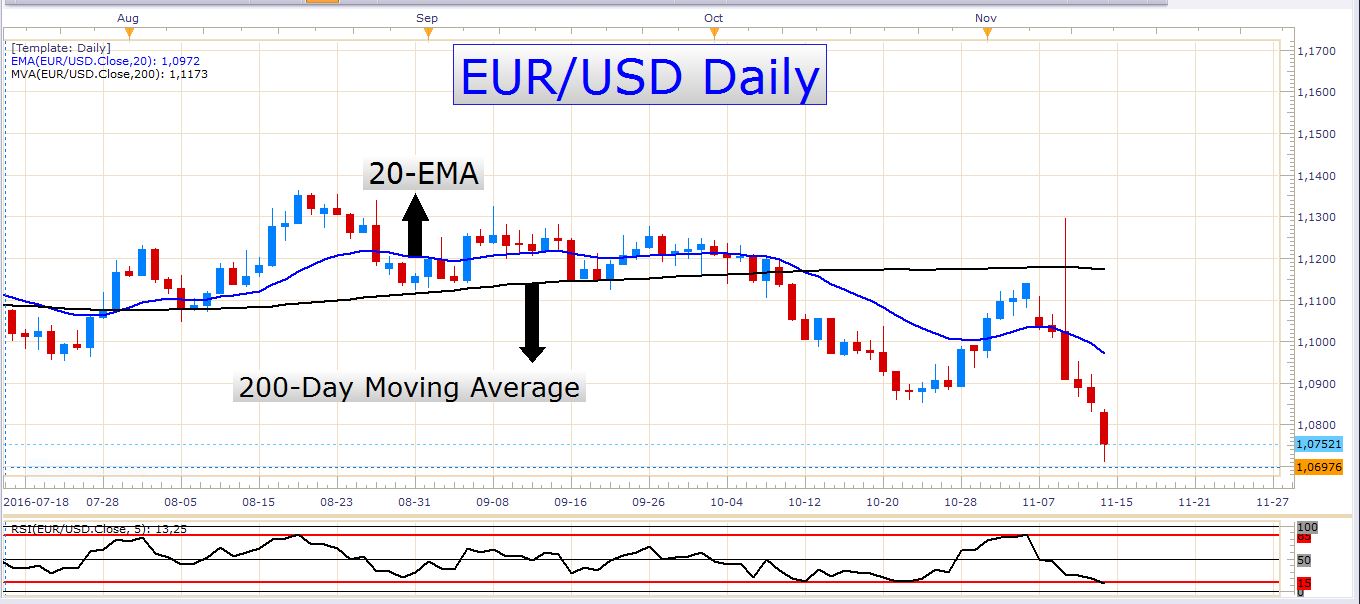
After gapping lower to start out the week, the EUR/USD proceeded to decline further throughout the day. The pair is currently about 105 pips below Friday’s close. With the US dollar that is currently so strong, there could easily be some follow through of the bearish momentum on this pair in the days ahead. Let us not exclude the possibility of a pullback in the next few days, however. The recent decline is very much extended, and this increases the probability that a retracement could take place soon.
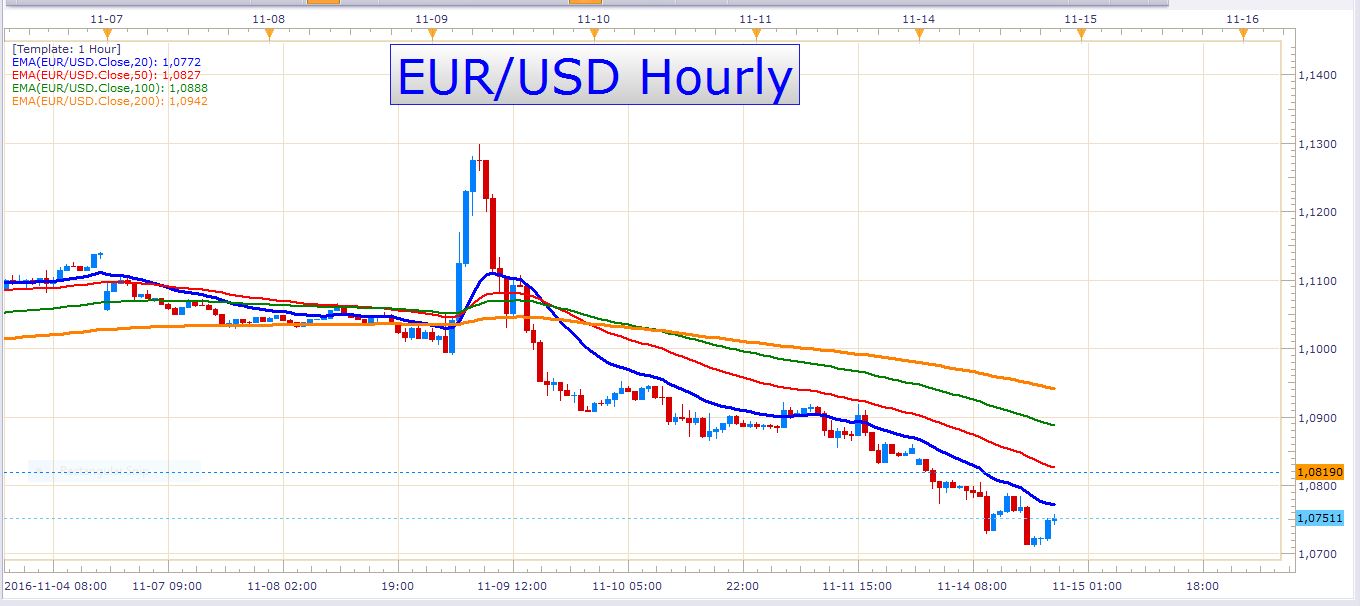
Here you can see that the price has been steadily resisted by the 20-EMA during the last couple of days. This exponential moving average has also offered great entry points for initiating short positions.
Tomorrow could be an active day for the EUR/USD again. There are some news events which could spark some volatility. At 07:00 GMT the German third quarter GDP numbers will be released. At 10:00 GMT it’s time for the European GDP numbers and the German (and European) ZEW economic sentiment index release. Later in the day, the US retail sales numbers could also trigger some tradable moves in this pair and other USD pairs.
USD/JPY
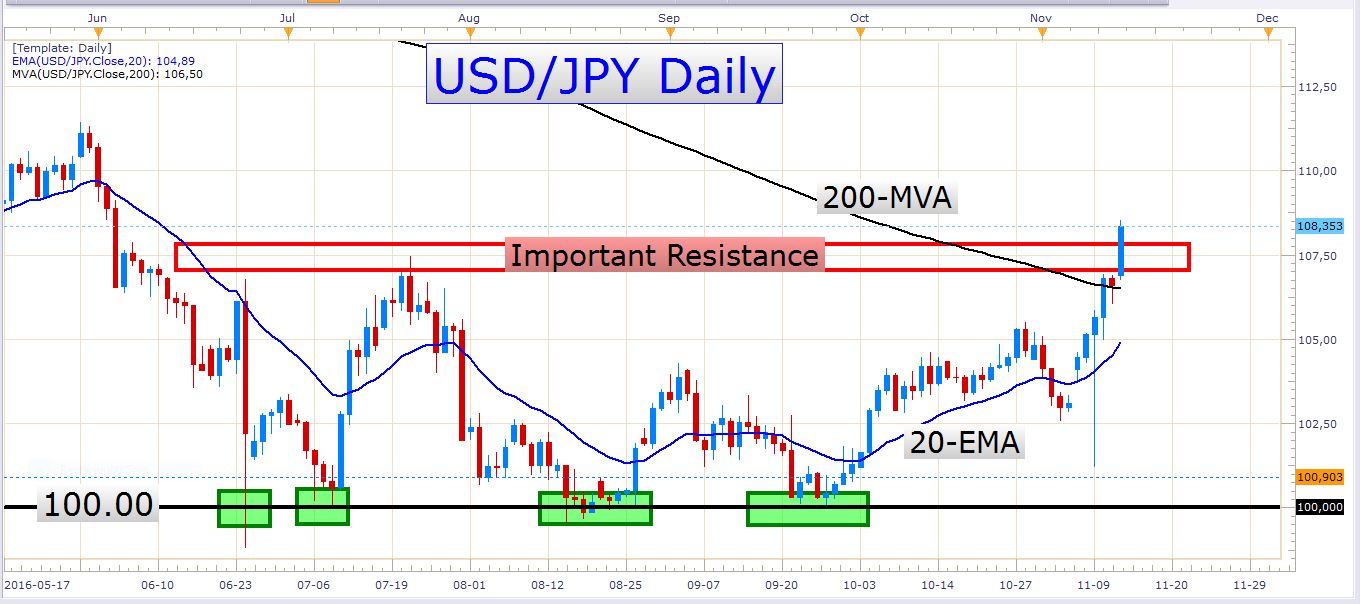
USD/JPY Daily Chart
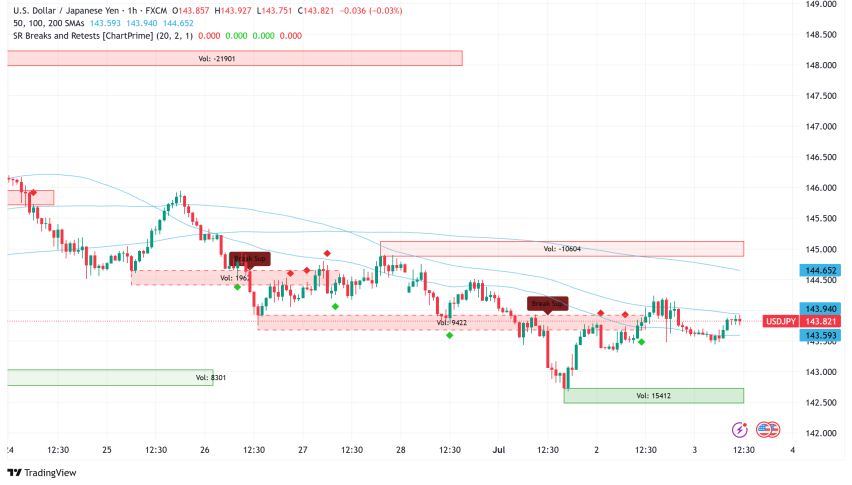
I mentioned in the previous article, that I would like to see the pair break through this red resistance zone. I didn’t need to wait long for this to happen, did I? As you can see, the pair closed firmly above this zone today, and if you weren’t convinced by Thursday and Friday’s close above the 200-day moving average, today’s daily candle will definitely change your mind. Let’s face it, the pair is in an uptrend now. We don't know how long this new trend will last, but for now, we should be siding with the bullish market players.
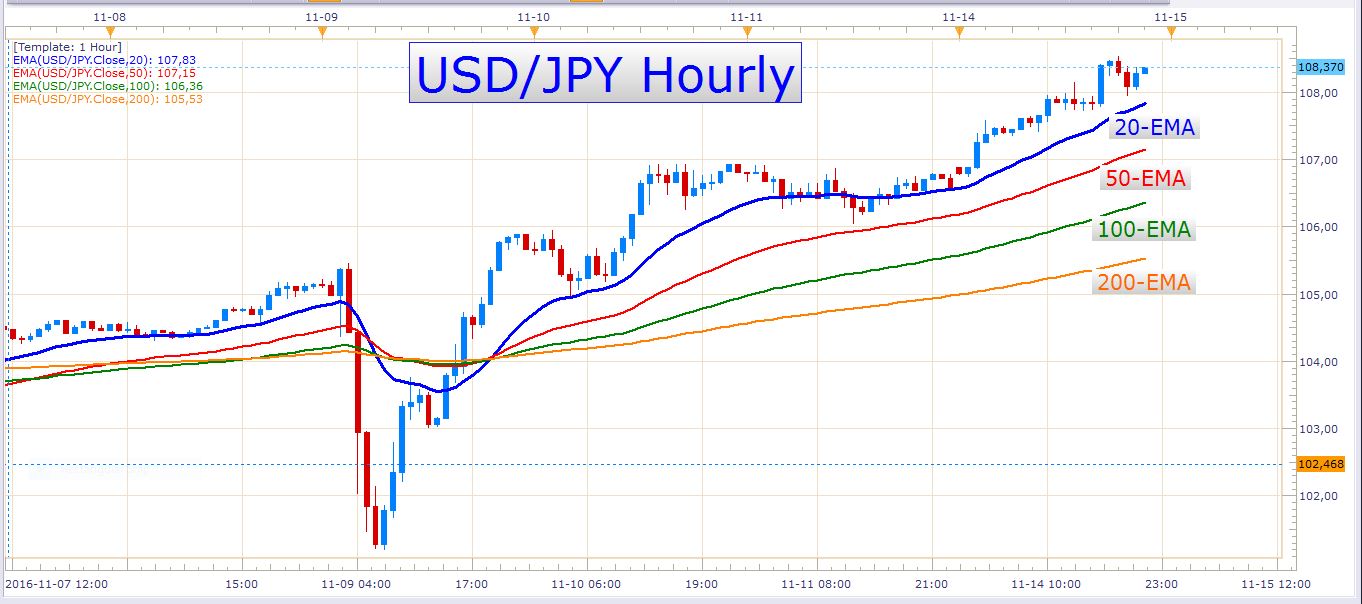
USD/JPY Hourly Chart
Here you can see how the pair rose steadily today. The buying pressure was so persistent that the price didn’t even touch the 20-EMA (the blue exponential moving average).
The last few days saw a very steep incline on USD/JPY charts, and I wonder how far this move will run before we encounter a notable pullback. Nevertheless, my bias remains firmly bullish and I will be on the lookout for opportunities to get long.
GBP/USD
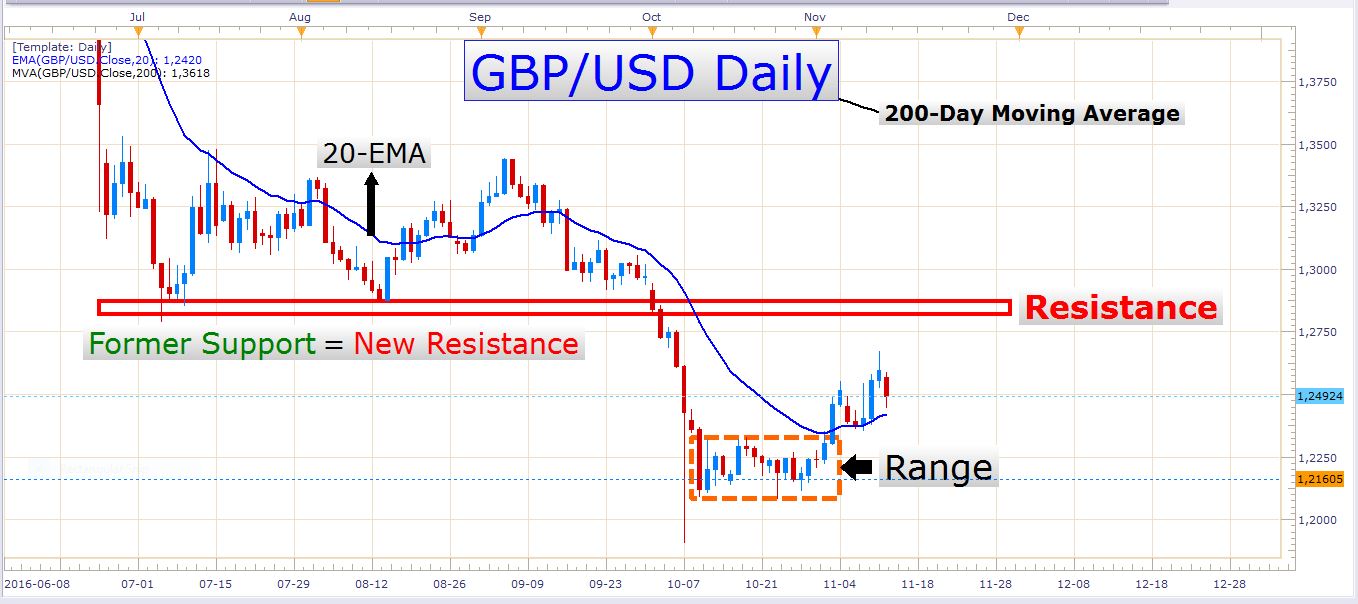
GBP/USD Daily Chart
I’m not very excited about this pair at the moment. I would have liked to see a stronger bullish move up to the red resistance zone on the chart above. It looks like the pound might have a hard time getting past the robust value of the US dollar in the next few days. There could be some sideways chop on the daily timeframe over the next few days, except if the UK data causes a strong, one-sided move which will either push the pound lower or pull it up higher. Tomorrow we have CPI numbers out of the UK at 09:30 GMT and inflation report hearings at 10:00 GMT. Both of these could have a major effect on the British pound, and you need to keep an eye on them if you’re going to trade pound pairs tomorrow. There is underlying strength in the pound, and better than expected data could produce a strong bounce in pound pairs. The US dollar is very strong at the moment, so a potential bounce-in-the-pound might play out better against other currencies like for instance the Canadian dollar which is much weaker than the US dollar at the moment.
USD/CHF
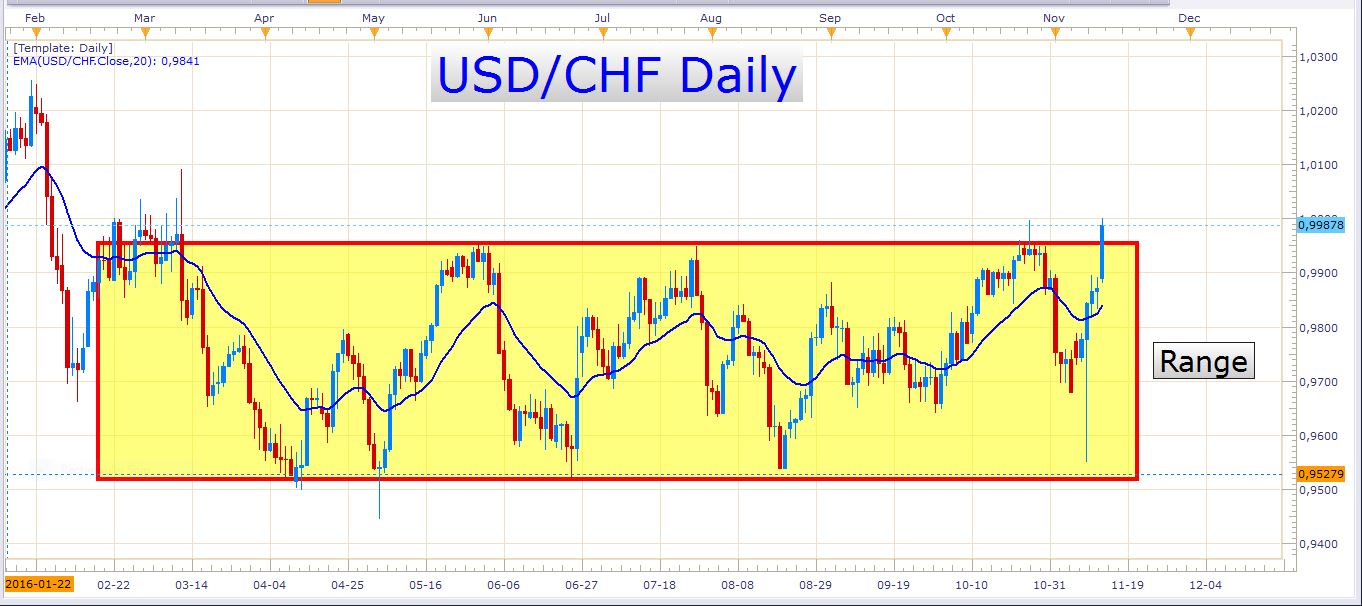
USD/CHF Daily Chart
It looks like we might finally get a convincing push out of this multi-month range. It will be interesting to see if a bull trend will arise from this breakout.
USD/CAD
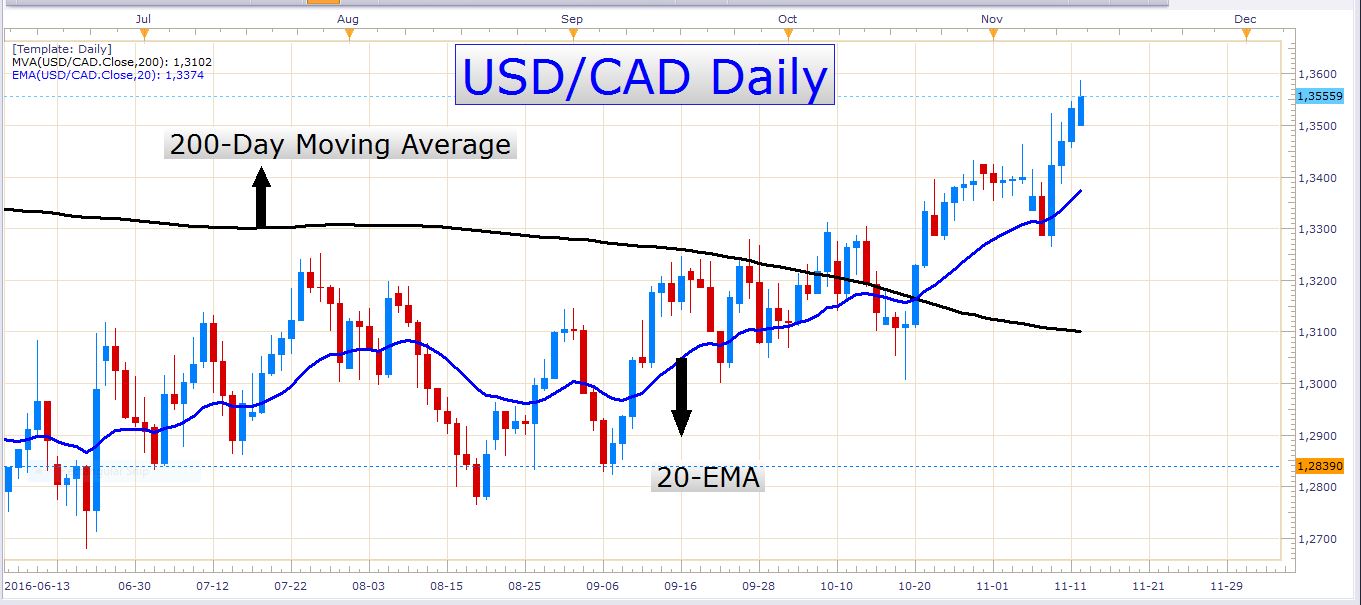
This pair has made remarkable progress in the last four trading days. The pair is relatively overbought at the moment, and perhaps some kind of a pullback might be on the way. Nevertheless, this remains one of my favorite pairs at the moment, and I think we might still get plenty of opportunities to buy dips in this uptrend.
If you are trading this pair or planning to trade it sometime, you need to keep an eye on the oil price as well. Over the last couple of days, there's been an aggressive decline in the oil price which has been reflected in the weak Canadian dollar. Although most of the bullish movement in the USD/CAD over the past few days can be ascribed to Trump’s presidential victory and the USD strength that resulted from it, the Canadian dollar has also been relatively weak. If the decline in the oil price continues, the USD/CAD would probably move higher and offer great buying opportunities to investors and speculators. Look at this powerful ascent on the daily chart:
USD/CAD Daily Chart
AUD/USD
If you are trading this pair at the moment, be aware that the RBA meeting minutes will be released at 00:30 GMT on Tuesday morning which could cause notable volatility in this pair.
Have a brilliant trading day!
- Check out our free forex signals
- Follow the top economic events on FX Leaders economic calendar
- Trade better, discover more Forex Trading Strategies
- Open a FREE Trading Account
