US Dollar Gains on a Quiet Day in the Markets, Aussie and Loonie News up on Wednesday
The markets were quite dormant on Tuesday. Even the RBA’s (Reserve bank of Australia’s) interest rate decision and rate statement had little effect on the Australian dollar. Perhaps market players are keeping some powder dry for the much anticipated ECB (European Central Bank) interest rate decision and press conference on Thursday. Perhaps Tuesday was just a bit slow because of the little important economic news.
In the meanwhile, as market participants wait for the ECB, the Australian dollar, and its Canadian counterpart could experience some decent movement. At 00:30 GMT on Wednesday, the Australian third quarter GDP numbers will be released. Perhaps this will cause more volatility than which the RBA rate decision and rate statement did on Tuesday.
Australian economic data was rather soft in November. It is thought that the continent’s economy could perhaps be facing some new headwinds and that the RBA may need to ease in the near future by further reducing their interest rate. The RBA commented on Tuesday that the global financial picture remains one of sub-trend growth. At least there is some light at the end of the tunnel for the Australian economy. Australia’s key export market, China, is showing signs of a stabilizing economy. A stronger Chinese economy would mean a greater demand for Australia’s commodities and other products which would be a great booster for the Australian economy.
AUD/USD
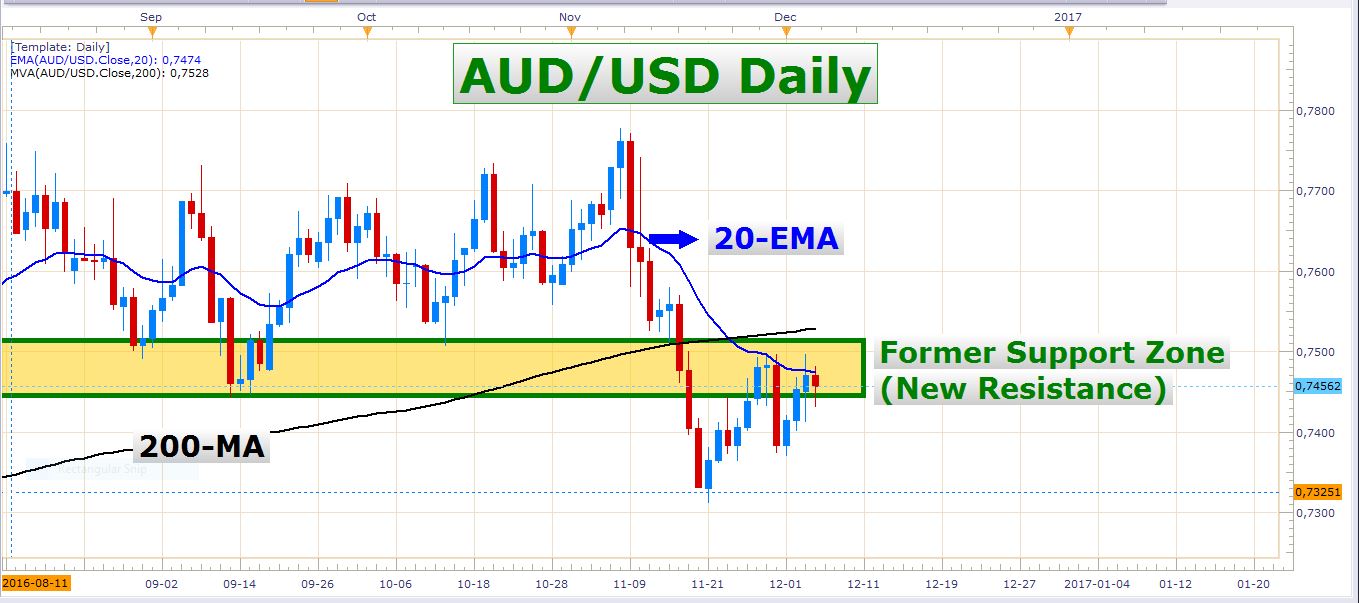 AUD/USD Daily Chart
The AUD/USD has failed to overcome the 20-day exponential moving average for the second time in the last couple of trading days. Perhaps this dynamic resistance level will keep a lid on the exchange rate over the near-term. If this were the case, the Aussie could possibly revisit the November lows before the end of the year.
The technicals suggest a further decline in the AUD/USD exchange rate could be on the cards. Think about it this way, the pair is trading below its 200-day moving average, and its 20-day exponential moving average. This means the long-term trend and the short-term trend are both down. This means we only want to look for opportunities to sell this pair at the moment. Ideally, we want some kind of confirmation on the lower timeframes that the bears are taking a clean lead once again. The reason for this approach is because we’re currently in a price consolidation and the price is above the 20-EMA on the hourly and 4-hour charts. Look at this hourly chart:
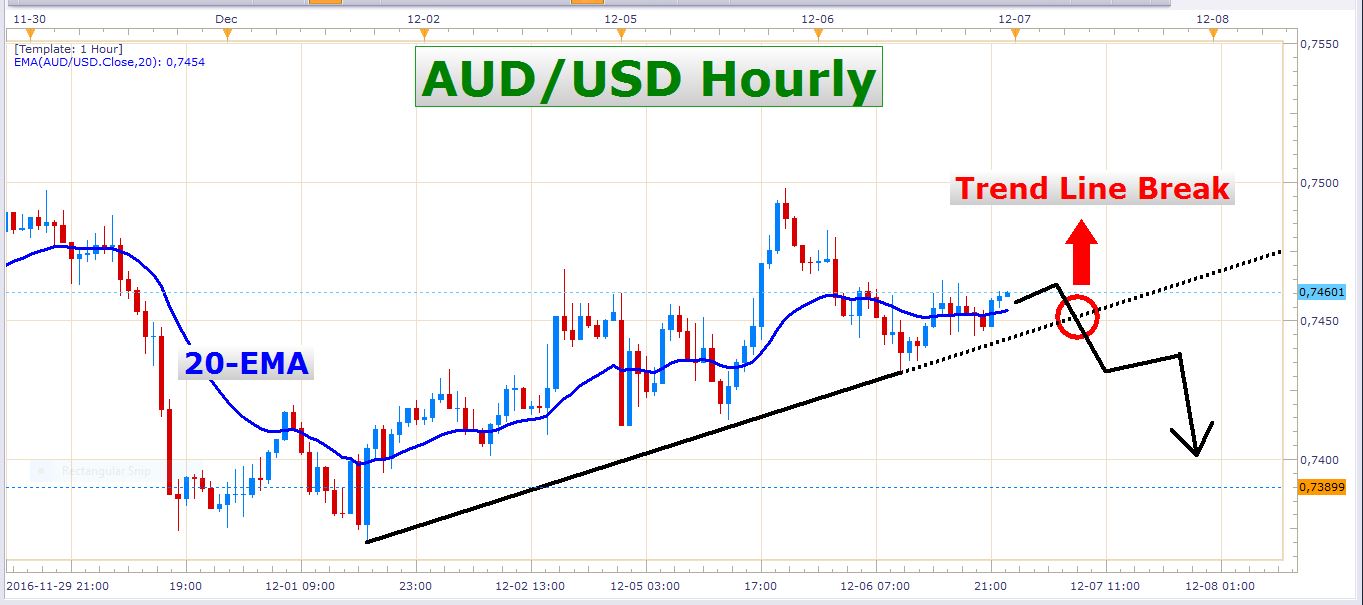 AUD/USD Hourly Chart
A break below the 20-EMA would be a good start, and a definite break of this trend line would be even better. You see, we don’t want to enter short positions on this pair before this upward momentum is broken.
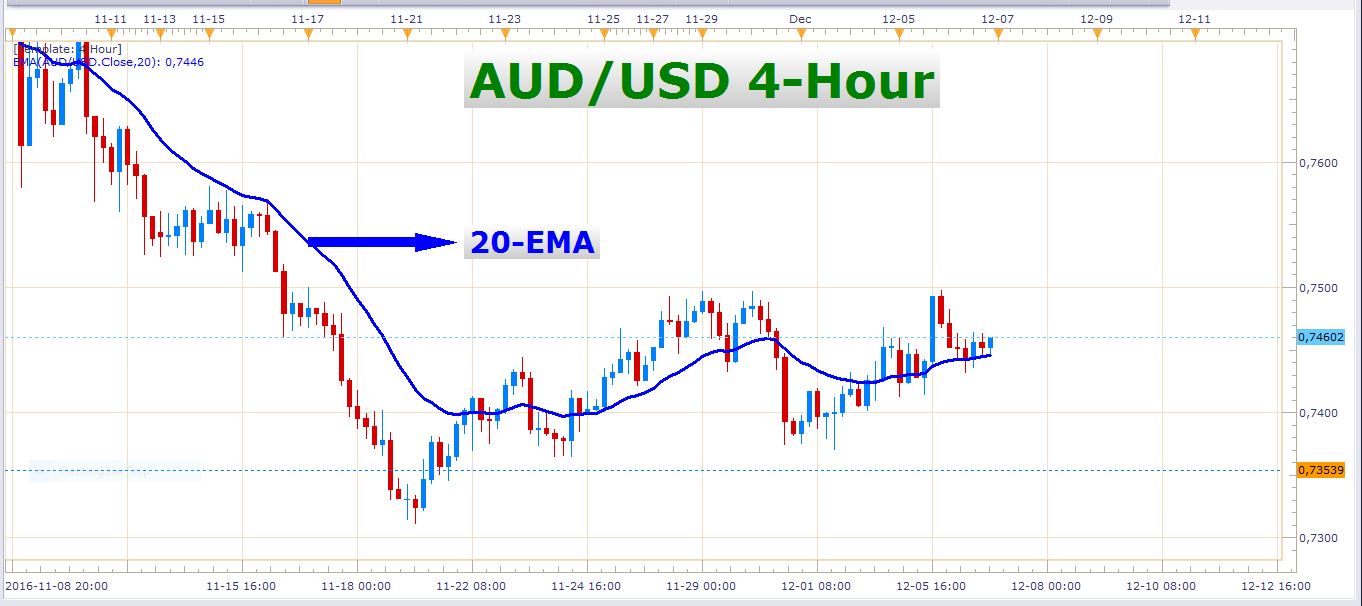 AUD/USD 4-Hour Chart
On this 4-hour chart, the picture looks basically the same as on the hourly chart – the price is above the 20-EMA and a slightly bullish tilt is present.
USD/CAD
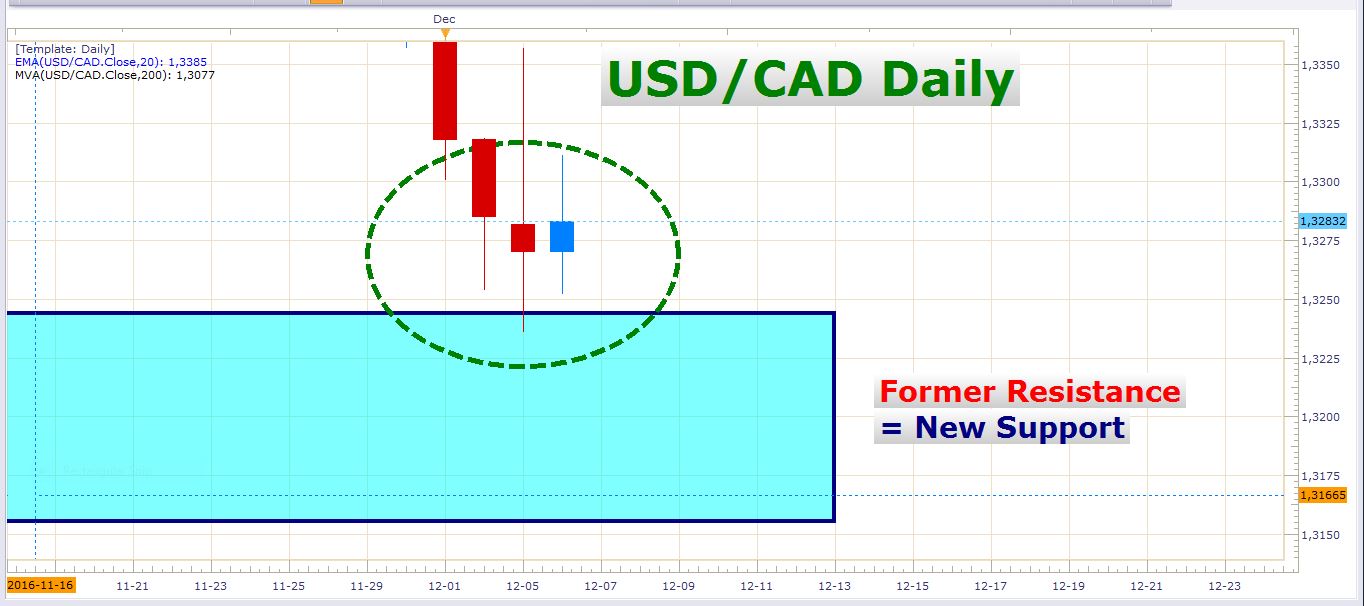
The USD/CAD has traded into a very important technical zone in the last few days. The previous resistance at this zone is what makes it so important. Many times an important resistance zone turns into an important support zone once it gets broken. This is often where buyers reload into some additional long exposure. Look at this daily chart of the USD/CAD:
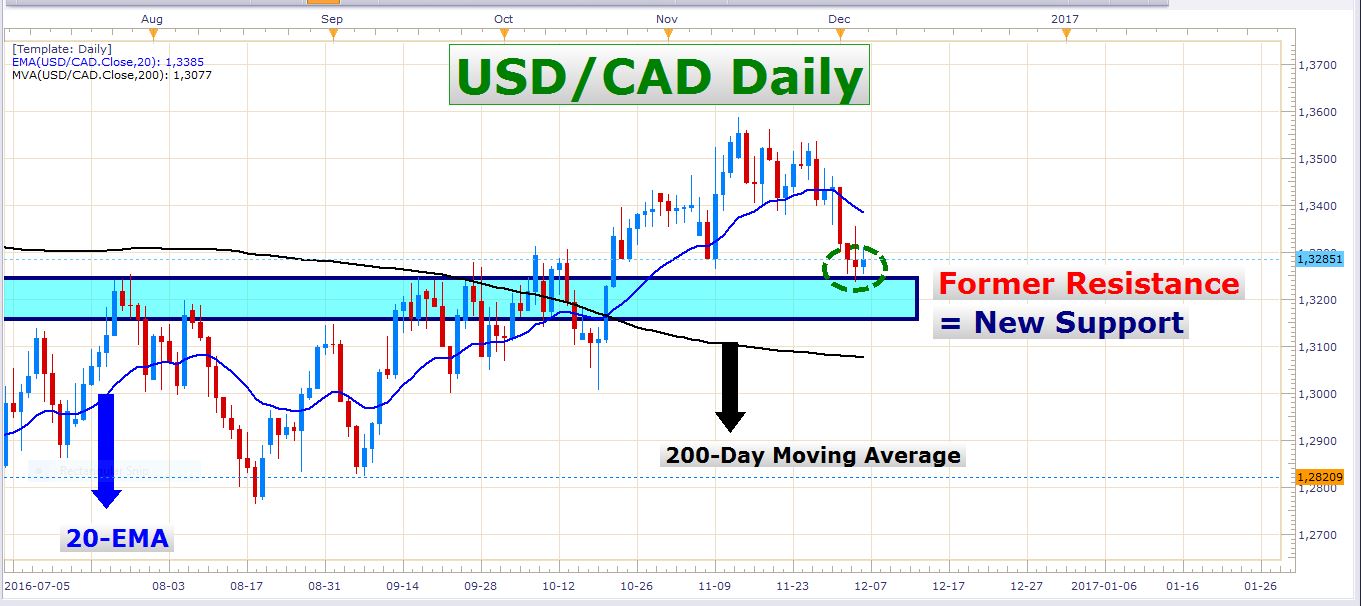 USD/CAD Daily Chart
Let’s zoom into this chart to see how the price action reacted to this new support zone in the last few days:
 USD/CAD Daily Chart
It is clear that a decent number of buyers either had some orders parked in this area or entered long at the market price when the pair retraced to this zone. If we want to be very technical, we can even argue that this support could have stepped in as a result of profit taking by traders who held short positions on this pair.
 US Oil Weekly Chart
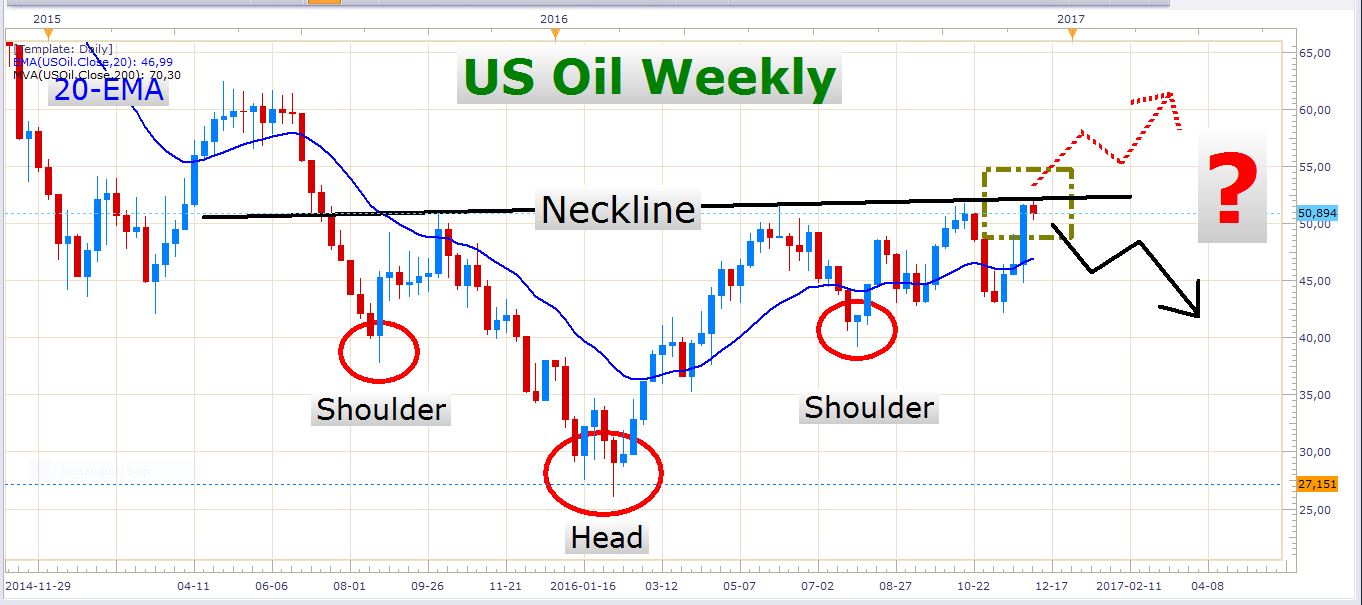
If we examine the price action of the largest commodity which drives the Canadian dollar, we see a large inverse head and shoulders pattern. At the moment, the oil price is trading at the neckline of this pattern, which makes this an important technical level.
 US Oil Daily Chart
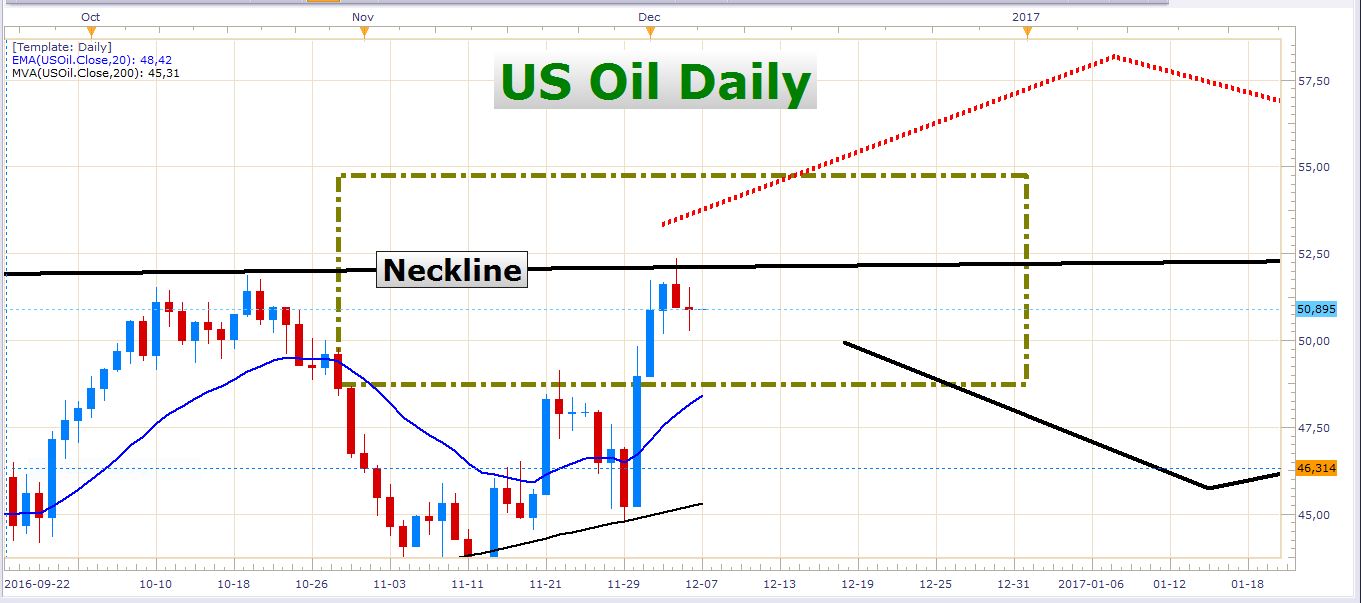
On this daily chart, it seems like the neckline of the pattern is forcefully resisting the price.
So the point I’m trying to make, is that if we saw an aggressive decline in the oil price soon, the USD/CAD could trade significantly higher on the back of Canadian dollar weakness. Especially if the US dollar regains its bullish momentum.
As mentioned earlier, the Bank of Canada has an interest rate decision on Wednesday. The release is at 15:00 GMT, so be careful if you’re trading any Canadian dollar pairs.
Have a splendid trading day!
- Check out our free forex signals
- Follow the top economic events on FX Leaders economic calendar
- Trade better, discover more Forex Trading Strategies
- Open a FREE Trading Account
- Read our latest reviews on: Avatrade, Exness, HFM and XM
Related Articles


Sidebar rates
Related Posts
