Does the US Dollar Bull Have Enough Muscle to Extend its Gains this week? Perhaps…
You know, currency trading is not easy at all, especially if you don’t learn from experienced traders. I remember how I struggled when I just started trading. I didn’t know anything about technical or fundamental analysis, neither did I know anyone who had ever traded forex. I ended up buying a trading course, and as one thing followed another, I soon had some proper trading knowledge and my experience in the markets grew gradually. Through the whole learning process, one cardinal characteristic of great traders often came to my mind – perseverance. I’ve heard of master traders who have blown their entire accounts first before they eventually made millions of dollars. I frequently hear of traders who tried forex trading, lost a few bucks, and gave up almost immediately. The main difference between these guys and the successful traders is the ability to endure the hardships of learning something which can be very difficult, but extremely rewarding. So if you’ve had a tough time trading so far, don’t give up. Keep on learning and trying because you will become profitable eventually. Your perseverance will pay off in the end.
Let’s look at a few charts and trading opportunities:
AUD/USD
This is one of my favorite pairs to trade at the moment. I booked some handsome profits trading it last week. I’m still holding on to a position on this pair which I’m allowing to run just to get some extra mileage out of the recent decline. Here is a daily chart of the AUD/USD:
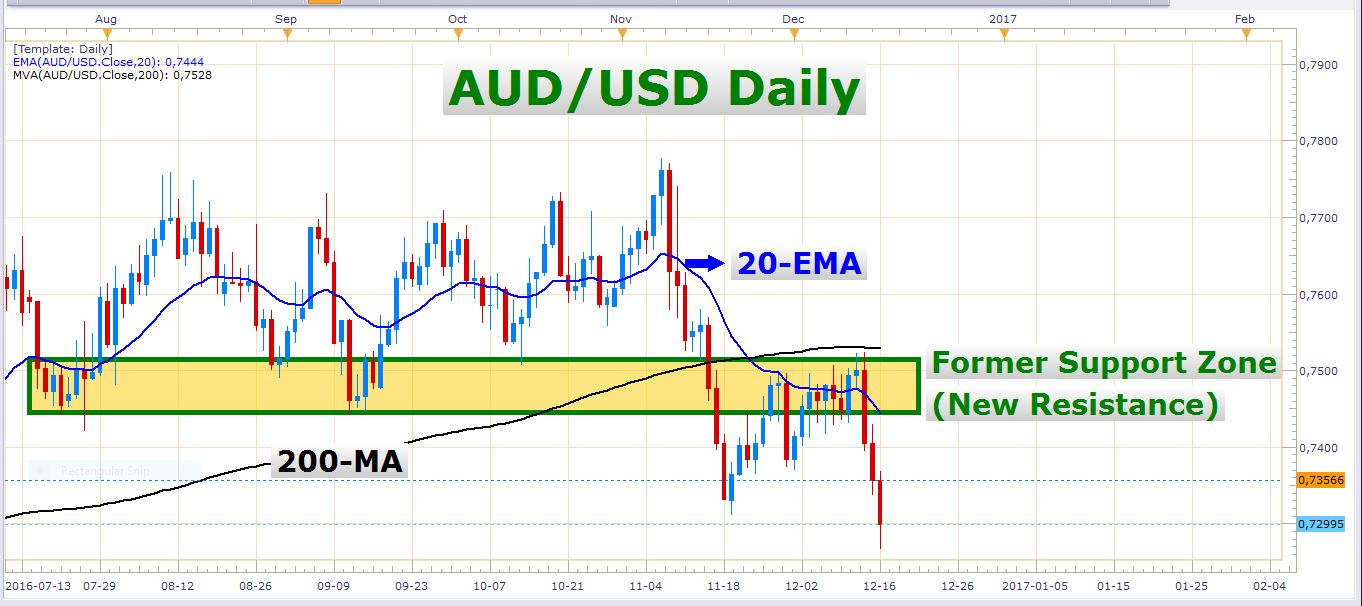
I’ve written about this former support zone quite a few times in the last couple of weeks. After trading into this zone, the pair eventually turned lower as expected. The confluence of this former support zone and the 200-day moving average (black moving average) was just too much for the bulls to overcome. If you look closely at the chart above, you will see that the pair traded up to the 200-day moving average on Wednesday and reversed less than 10 pips shy of it. It doesn’t surprise me because I know this is a very important moving average which is widely observed by many traders. It often acts as support or resistance on many different instruments.
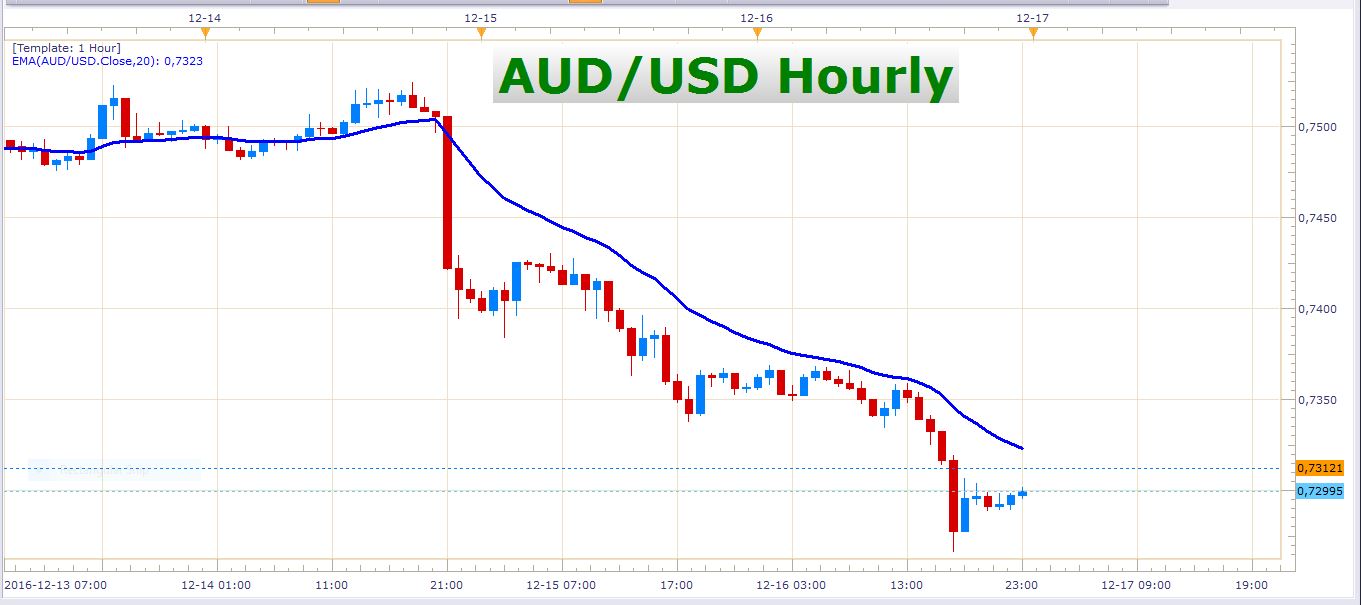
On this chart, you can see that the pair declined very aggressively after the FED’s rate decision on Wednesday last week. The price hasn’t even touched the 20-EMA since then. Whether this momentum will carry over into this week is uncertain, but my bias will remain bearish as long as the price prints lower lows and lower highs. This pair has handsomely rewarded me in the last few days, and I am on the lookout for more opportunities to sell it.
EUR/USD
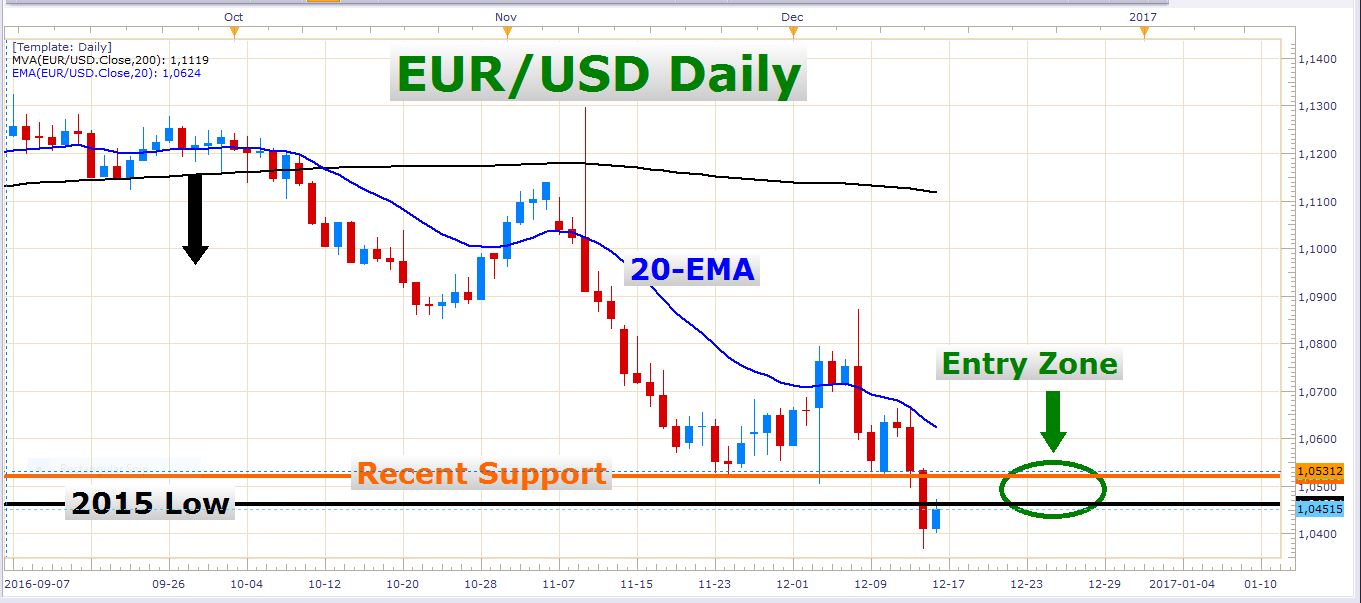
I mentioned last week, that I expected the pair to revisit the 2015 low after it had breached it on Thursday last week. This is exactly what happened on Friday as the price breached it by about 10 pips. If you didn’t seize this opportunity to sell the pair, you might get a chance to do so in the week to come. My preferred sell zone is between the black and orange horizontal lines on the chart above, marked ‘entry zone’.
US Dollar Index
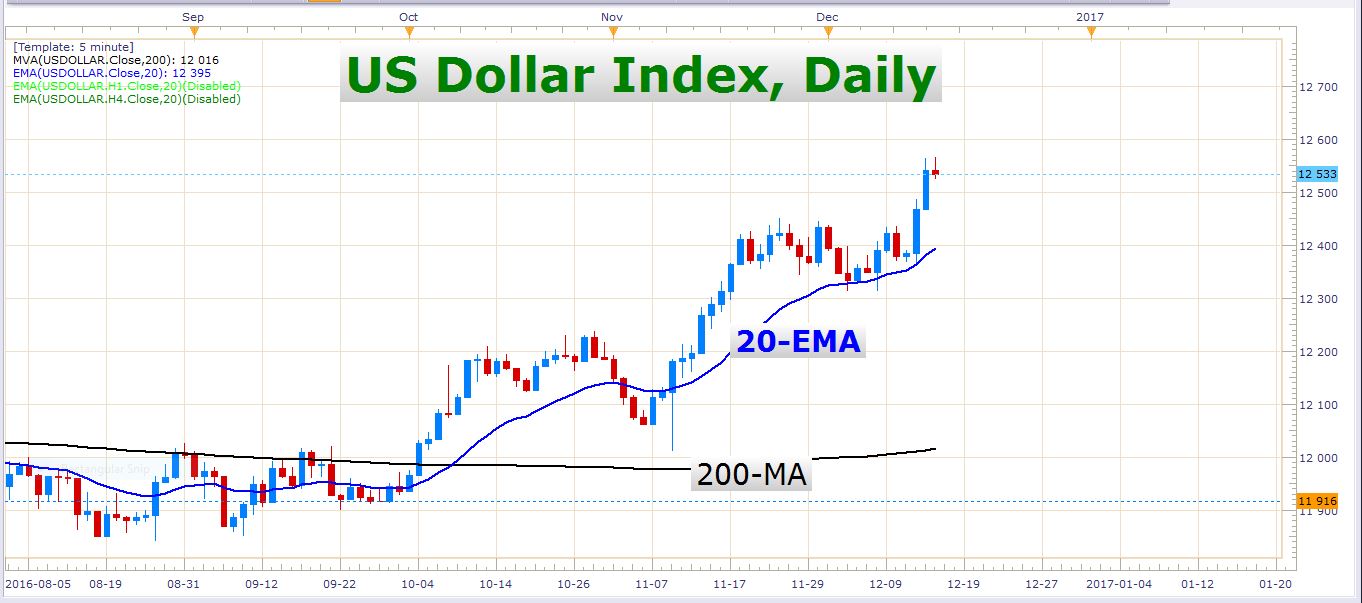
I think it’s very important for any trader to be aware of the current US dollar strength. This index is an equally weighted composite of four major currencies against the US dollar – the Australian dollar, Euro, British pound, and the Japanese yen. As you may have noticed, this index is printing higher highs and higher lows, which is a characteristic of a healthy uptrend. Considering this impressive bullish momentum, it could be risky to short the US dollar against any currency pair in the week to come. Of course, things can change very quickly in the FX market, but we need sufficient evidence of a trend reversal before we can consider shorting the US dollar.
USD/CHF
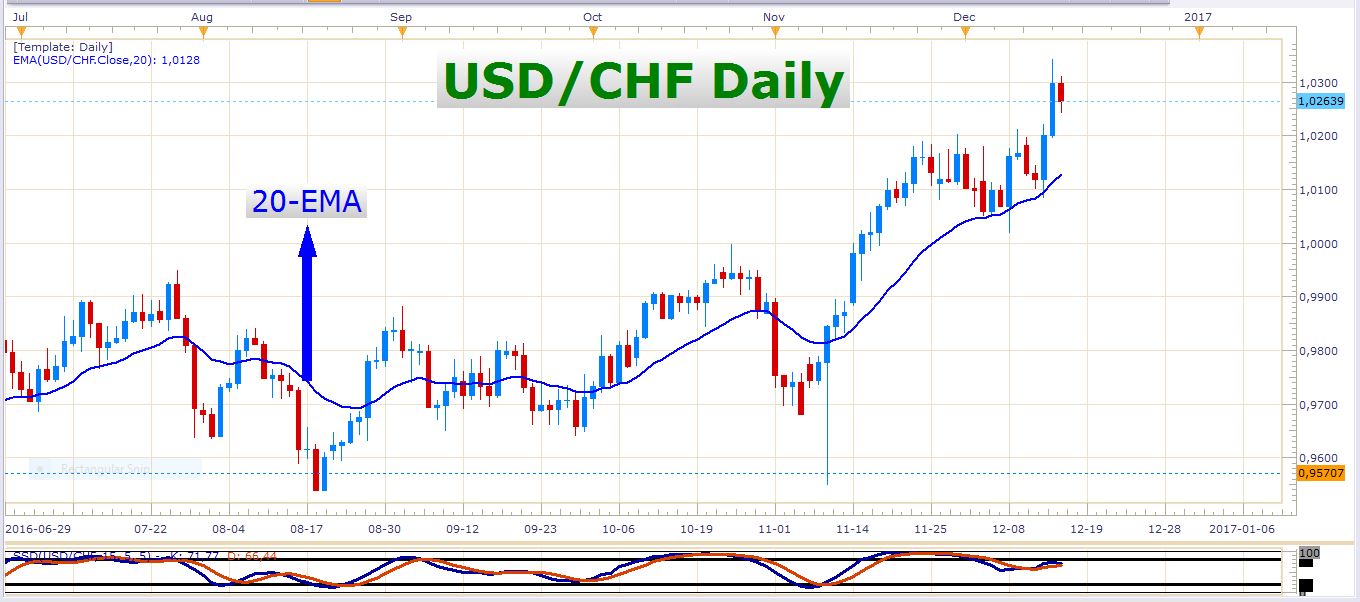
This pair has just soared on the back of US dollar strength lately. I expect a further rise in the exchange rate over the next few weeks. Look at the robust bullish momentum on this daily chart:
USD/JPY
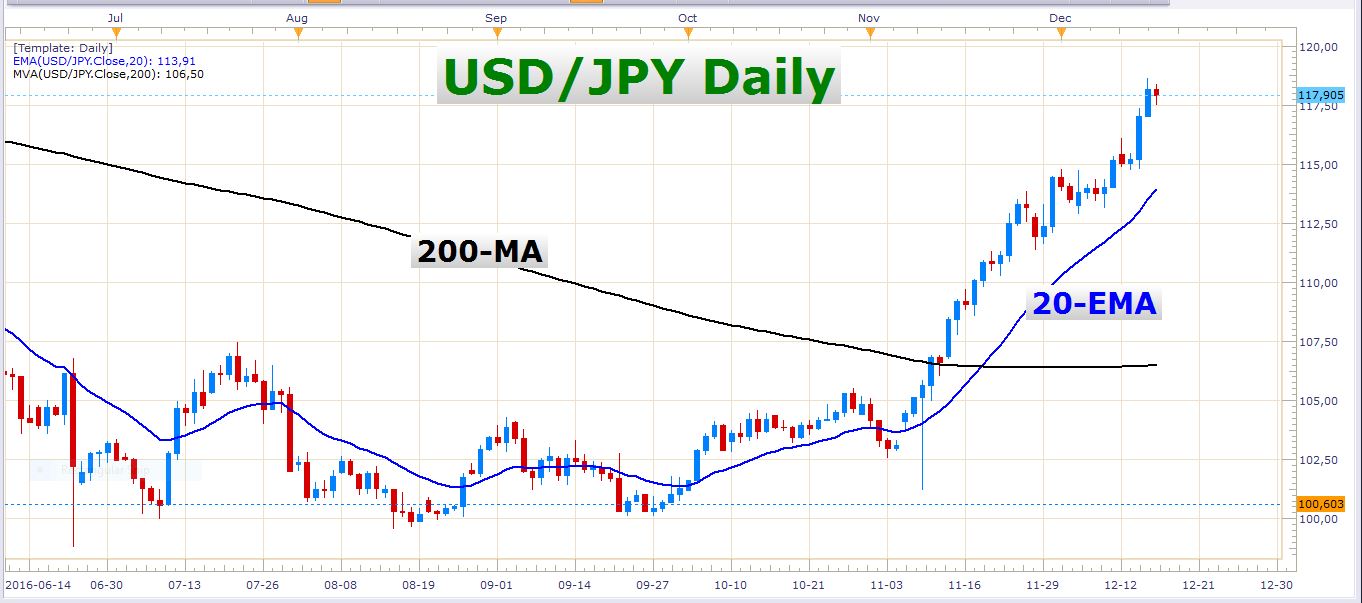
The same counts for the USD/JPY. There is no reason to fight such a mighty trend. Look at the following chart:
USD/CAD
Here you need to be careful! Unlike all the other pairs I’ve discussed so far, the US dollar has not advanced to new highs against the Canadian dollar on a daily timeframe in the last week or two. Look at this daily chart:
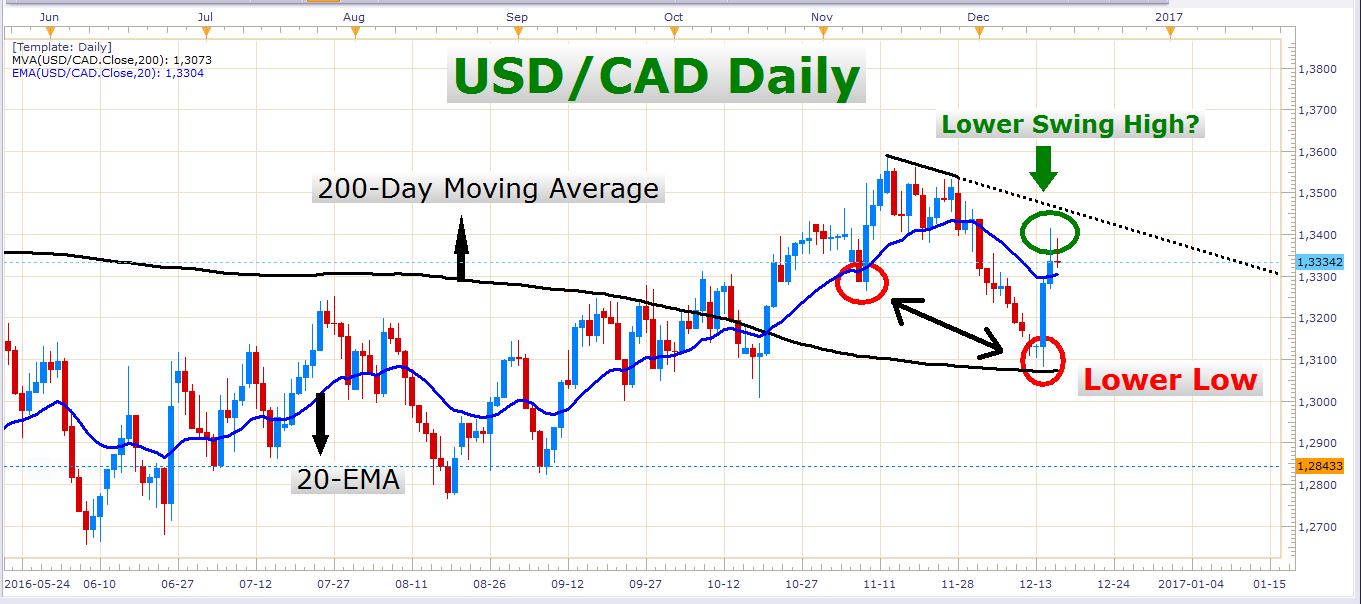
You can clearly see that the Canadian dollar has done a very good job of resisting the US dollar. Much of this has to do with the recent rise in the oil price which favors Canadian dollar strength. If you were thinking of buying the USD/CAD, just be aware that there are many currencies which are weaker than the Canadian dollar at the moment, and buying the USD/CAD could result in a very tough trade, which is unnecessary.
Economic News
Besides the GDP numbers out of the US, UK, and New Zealand, there aren't many important news events this week. On Monday, the only relatively important event is the German Ifo business climate index number which could have an effect on the Euro.
As we approach the end of the year, we could perhaps encounter some irrational market volatility as year-end flows take place.
Personally, I will be following the major prevalent trends in the week to come. I hope you bank some great profits this week. It might be the last active week of the year before the festive liquidity drain, which could limit market movement.
All the best, and may you have a prosperous week!
- Check out our free forex signals
- Follow the top economic events on FX Leaders economic calendar
- Trade better, discover more Forex Trading Strategies
- Open a FREE Trading Account


