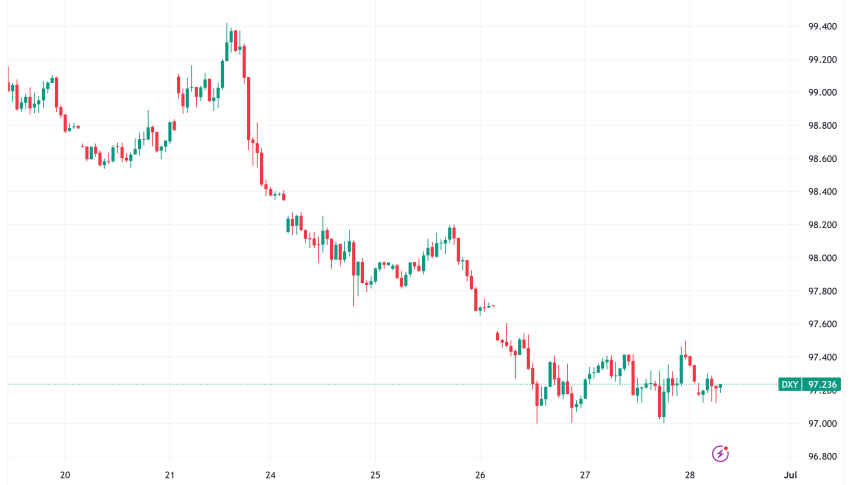
US Dollar Slams Commodity Currencies – USD/CAD Shoots Through Trendline Resistance
When I started learning about forex trading years ago, I was astonished at the immense liquidity of this market. With an average turnover of more than $5 trillion per day, it's the largest market on this planet by far!
Imagine starting a business which taps into a market with virtually unlimited buyers and sellers. Where else could you possibly find the opportunity to compound your profits effortlessly and grow your business exponentially without the traditional hurdles of expanding physical infrastructure, workforce, and so forth? I’m sure you get what I’m saying. The FX market offers this opportunity, although trading it can be tough at times.
Today was a fairly easy trading day, for the simple reason that some of the major trends continued steadily on their paths. One of my favorites, the AUD/USD, continued to move lower today, despite being quite oversold already. Let’s take a closer look at the Aussie, ‘mates’…
Trading the Aussie Down Under
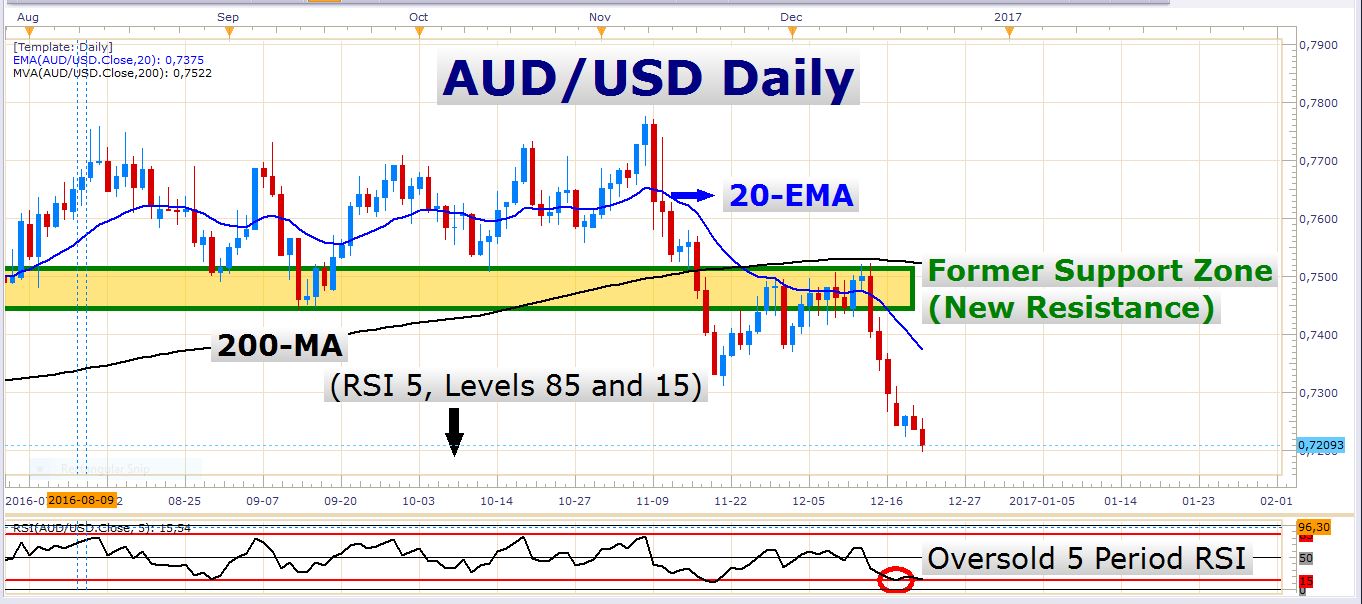
I’ve been trading the pips out of this pair. And it’s not because I’m so good or anything, it has just been so easy. You see, if there’s a nice downtrend in play, and you stay with the trend and set reasonable targets and stops, you can’t achieve anything else but a handsome profit.
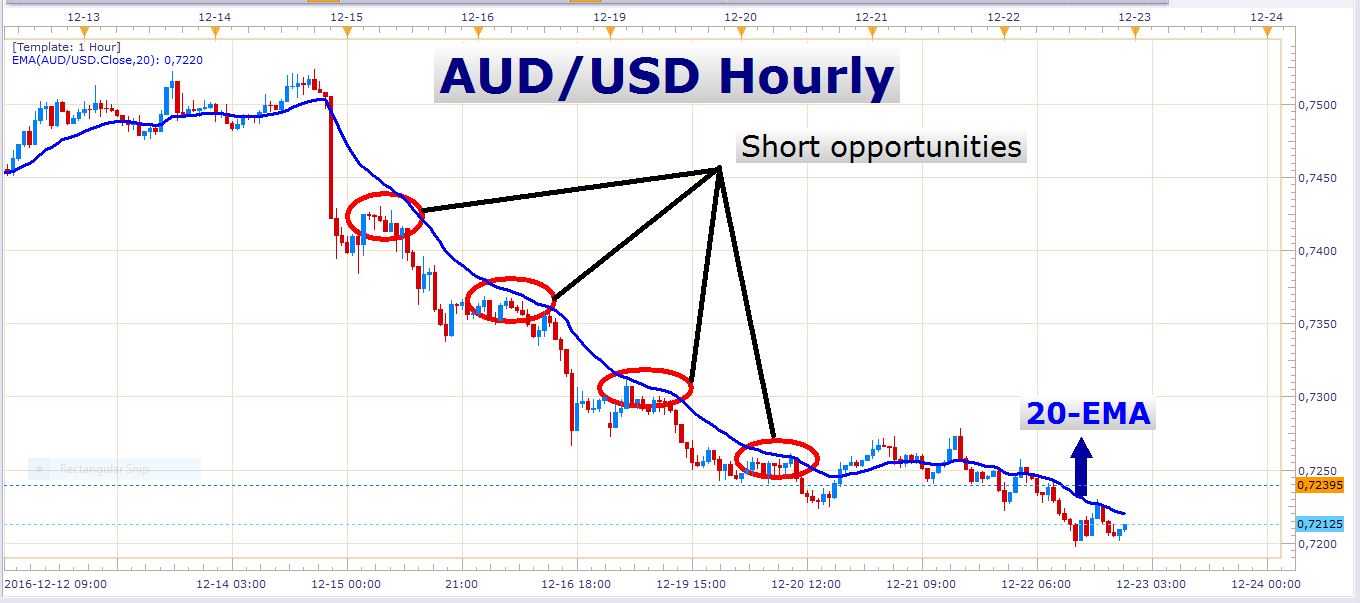
In a strong downtrend like this, trading weak retracements, is relatively easy, even for a beginner trader. There are many different ways to do this, but a simple way would be to sell on retracements which bring the price closer to the 20-EMA. Let’s say you used a stop loss of 35 pips and a target of between 40 and 70 pips – you would have won at least three times out of the four entries displayed on the chart above.
As long as the bearish structure on the AUD/USD remains in play, there could be more opportunities to make a buck on the short side. Let’s see what happens in the next week or two. Just be careful of a possible retracement in the next few days; the pair is currently quite oversold, so a bounce of some sort may occur soon.
Today’s Surprize – The USD/CAD
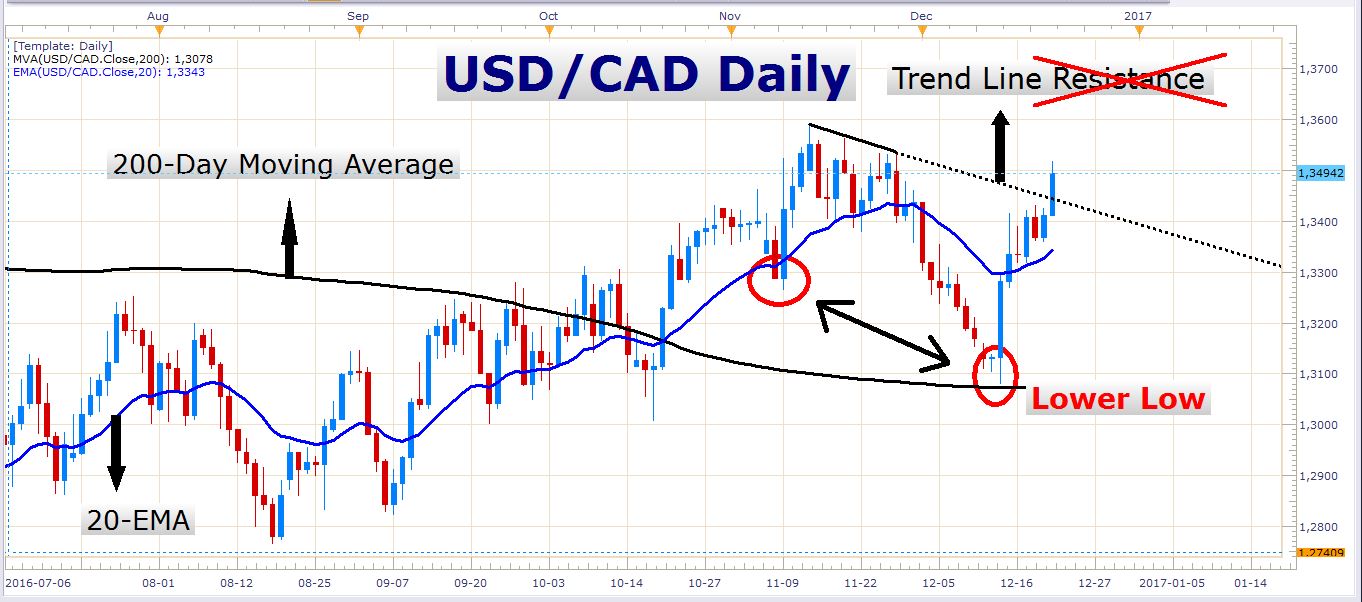
I have to say, I didn’t expect the USD/CAD to break through this trend line so effortlessly. You can see I crossed out the ‘resistance’ in the chart above because this trend line ain’t gonna resist no more, at least not soon.
You see, it wasn’t just this trendline that I considered in the resistance equation, but also the following fib level:
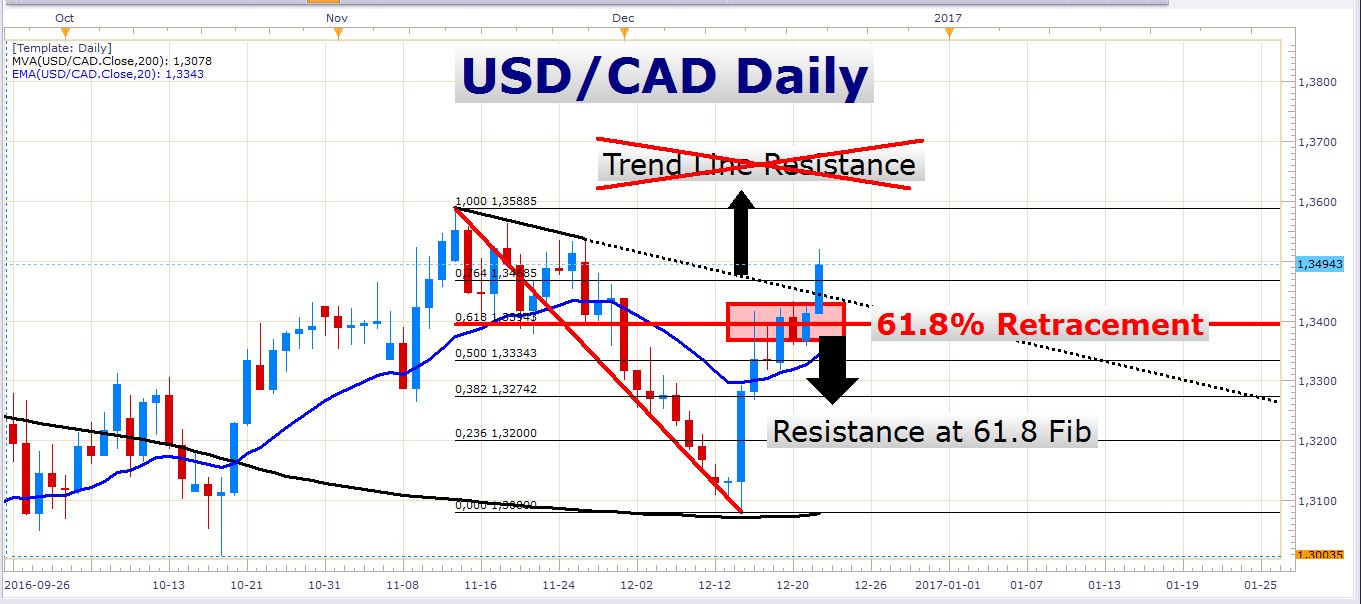
The pair certainly bumped into some firm resistance at the 61.8% level.
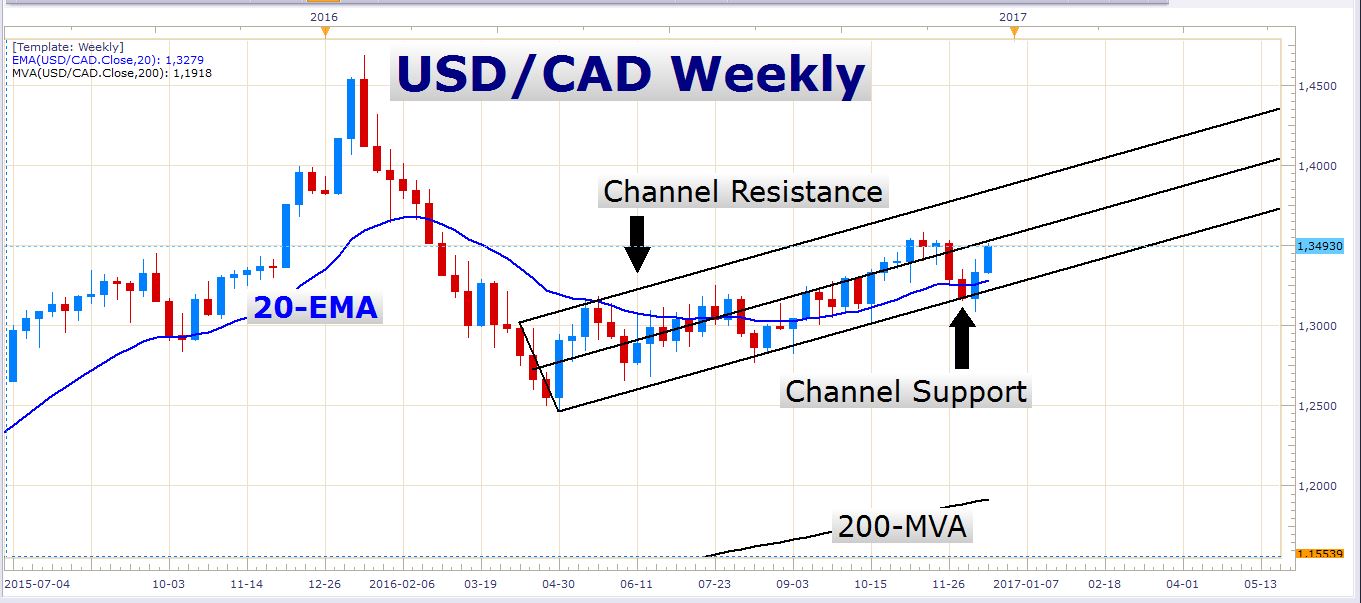
I mentioned in the previous article, that the pair is trading above its 200-day moving average. Technically, this means that the pair can be considered to be in an uptrend. This weekly chart confirms this view, and you can see that the bullish momentum is definitely still intact.
Last, but not the least – EUR/USD
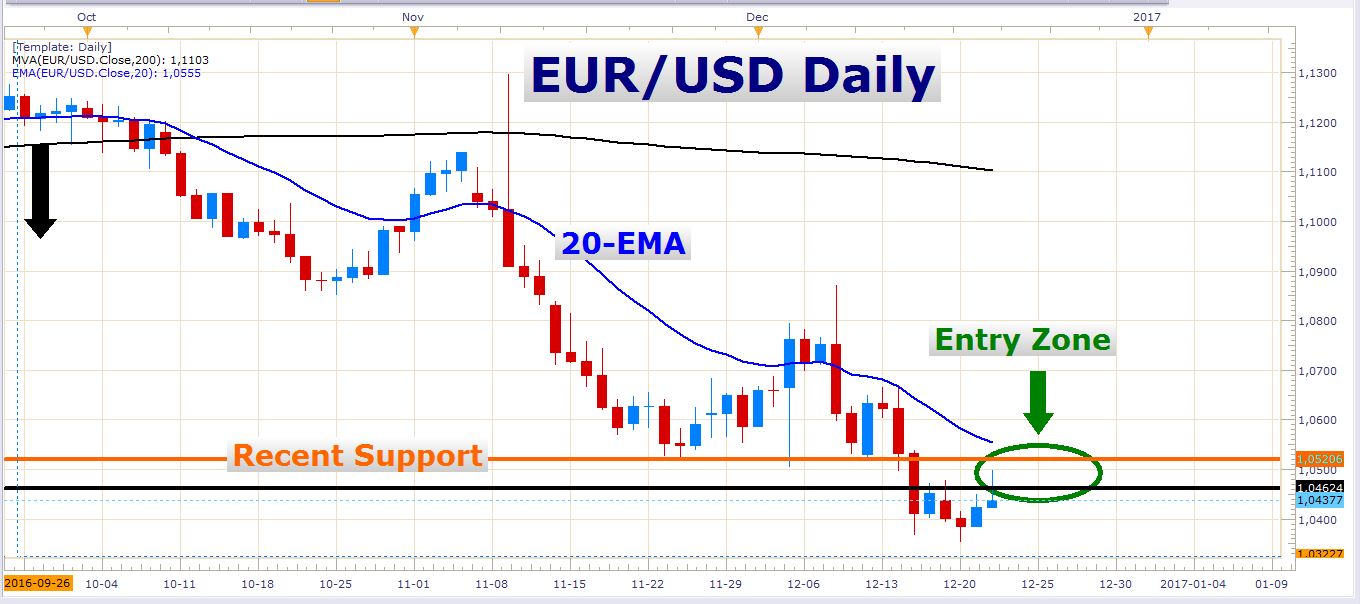
I’ve written much about this pair lately, and this specific chart. Before you get bored with this chart, just look at how the exchange rate visited the sell zone once again. More importantly, the pair closed below this zone today, which means that if you had entered between the black and orange lines today, your position would have been in profit already.
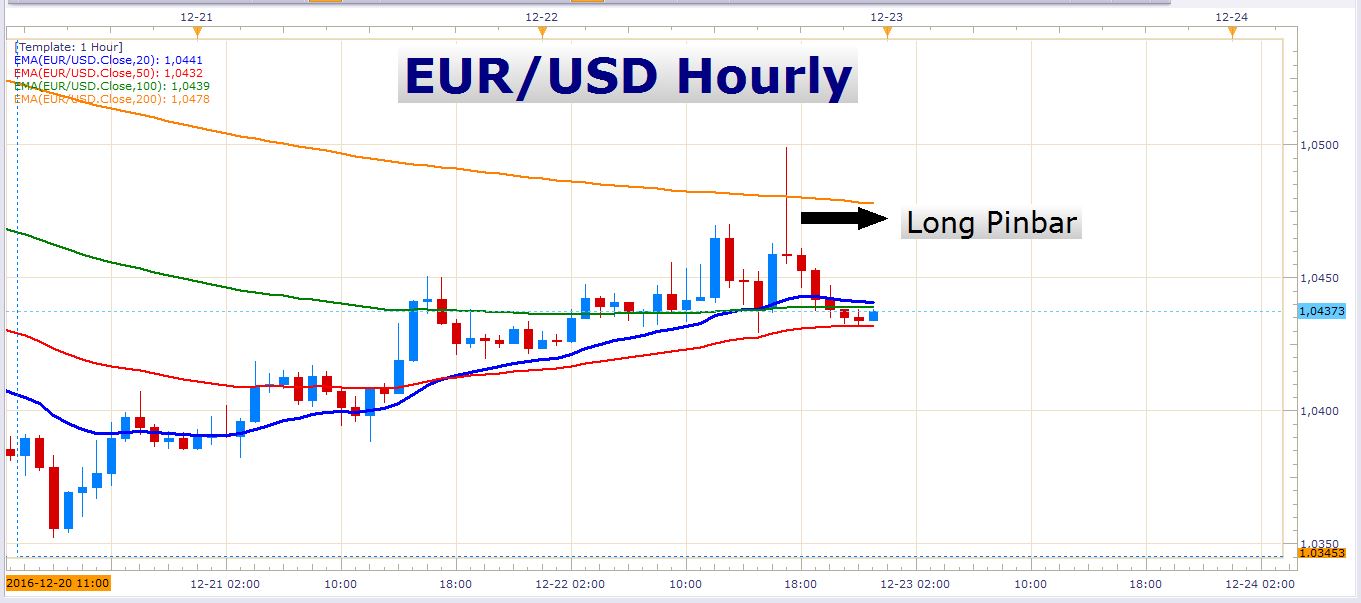
This long pinbar candle tells us that there was competition to sell the pair in that price range. This pinbar is roughly contained in the range of the sell zone displayed on the daily chart earlier in this article.
My bias on the EUR/USD remains bearish, and I expect the pair to trade gradually lower over the next two weeks.
Economic market movers (News)
Tomorrow (Friday) we have GDP numbers out of Canada and the UK. I doubt whether the market will be extremely active tomorrow. It is a holiday in Japan, and the UK markets will close early for the weekend’s celebrations.
Best of luck for tomorrow’s trading!
- Check out our free forex signals
- Follow the top economic events on FX Leaders economic calendar
- Trade better, discover more Forex Trading Strategies
- Open a FREE Trading Account


