Gold Bull Run to Run Out of Steam Soon
The time has come to expand our analysis to a few other instruments, including certain commodities. Let’s kick off with one of my favorites – GOLD.
My grandmother’s father had a goldmine in a Southern African country called Rhodesia, which is now known as Zimbabwe. The amount of gold that he mined on a daily basis was about the size of a golf ball when they put it together at the end of each day. This is about 25 Troy ounces per day, which would have been slightly less than $30,000 at today's spot price.
However, back then (1937), gold was relatively cheap at a regulated 35$ per ounce. 30 years later, when my own father was about 15 years old, gold was still cheap at $35.50 per ounce (still regulated). My father once told me that he could easily afford to buy his girlfriend heavy golden jewelry in those days.
Now perhaps you are curious to know how much gold I inherited from my great grandfather, but that’s a story for another day.
In the meanwhile, after a couple of shifts and adaptations in the global monetary systems, gold has become relatively much more expensive than back in my ancestors’ days. I say ‘relatively’ to negate the effect of inflation. Let’s take a look at where the price is now, and more importantly, how we can trade this shiny commodity and make some money out of it. Here is a weekly chart of spot gold:
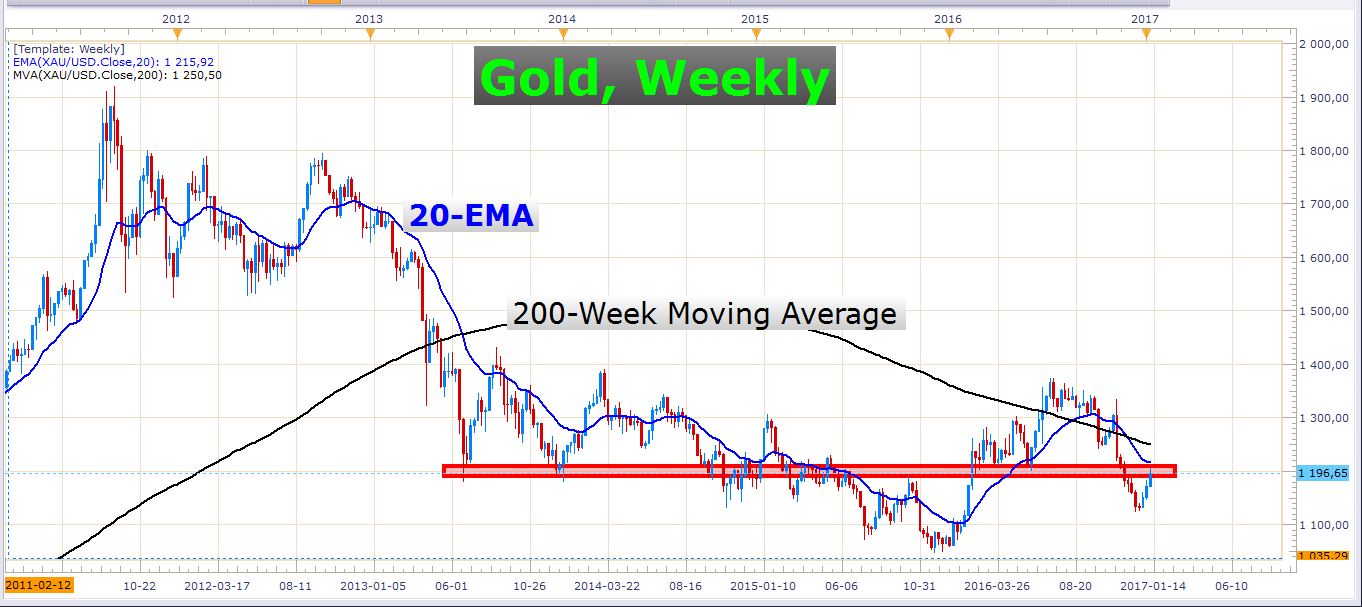 Gold, Weekly Chart
Perhaps you can’t see the current price on this screenshot. At the moment it is $1197.60 per ounce. Now that’s a massive jump from 35 dollars! The all-time high is a whopping $1920.80. This was achieved back in 2011. Let’s move down to a daily chart:
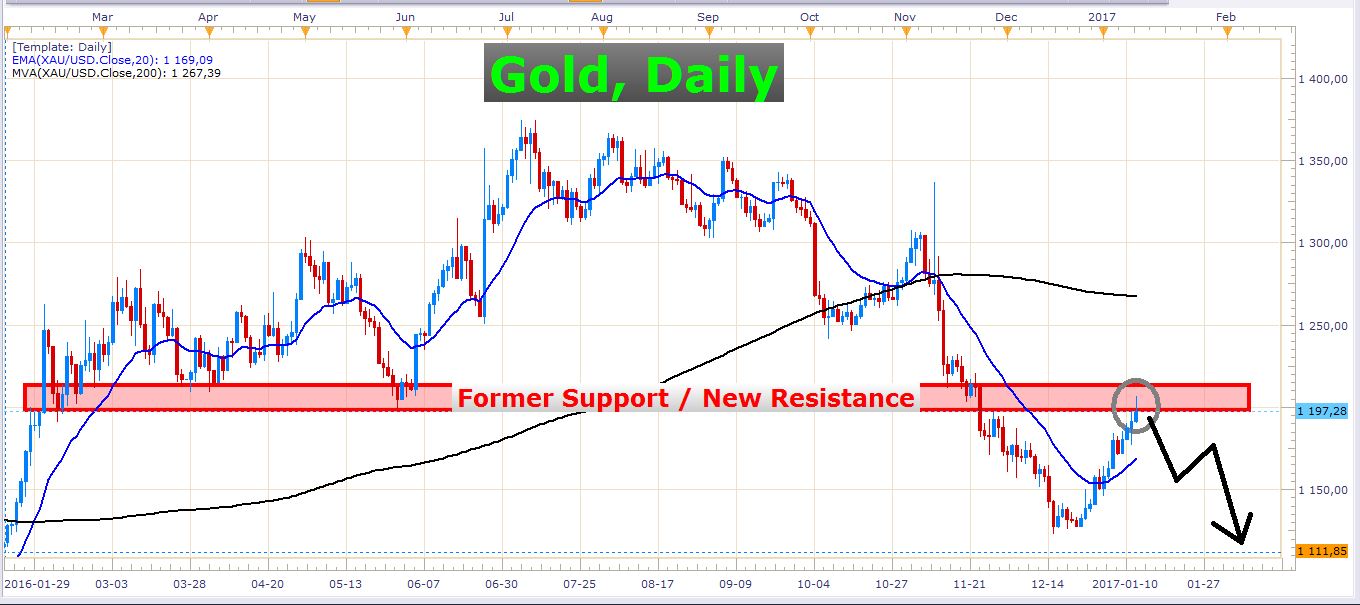 Gold, Daily Chart
Let’s zoom in a bit…
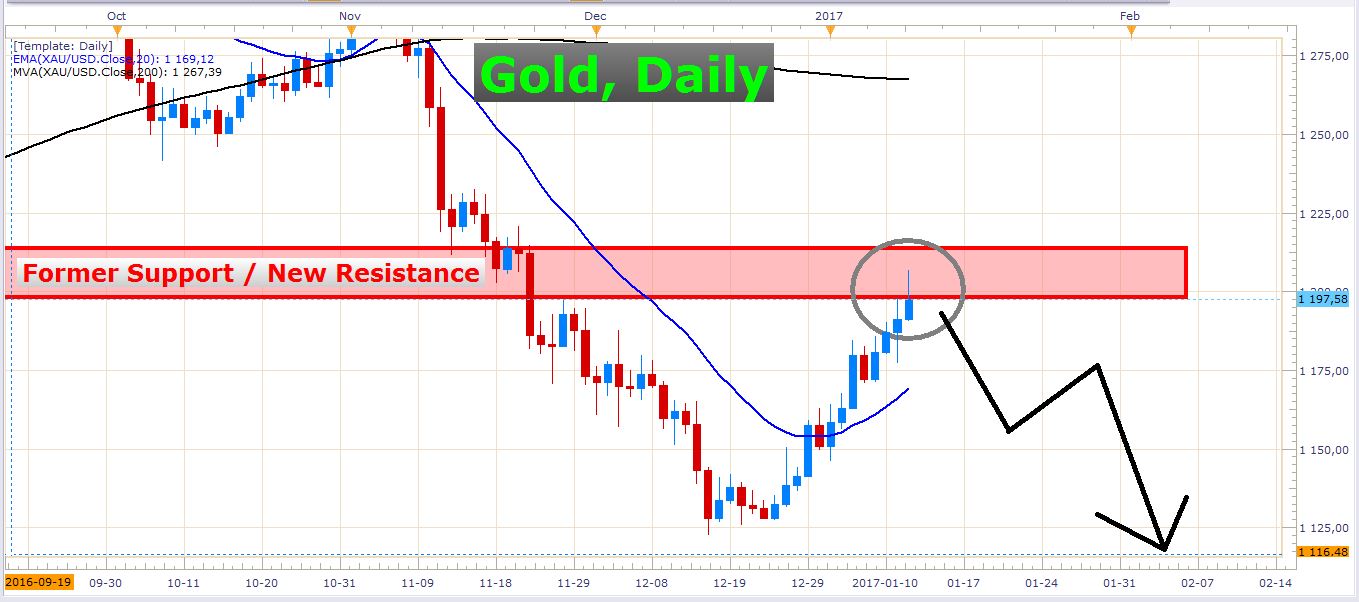 Gold, Daily Chart
As you can see on the chart above, the price managed to trade into this former support zone today but has lost a bit of steam towards the end of the day.
This red zone is likely to offer resistance in the days to come. We can observe the price action around this zone to see if we get a strong rejection candle like a large pinbar, or some other strong bearish signal. I wouldn’t advise entering immediately, we need bearish confirmation before we can safely engage in short positions.
From a cyclical point of view, the range of this last bullish wave suggests that a turning point may be near, so let’s see what happens in the next couple of days.
USD/JPY – Deadly Double Top in Play
There is a definite weakness in the USD/JPY exchange rate. The bulls have struck a concrete wall of resistance at an important long-term Fibonacci level (please see my previous article for more details).
Besides this, the bears also hit this pair hard after it formed a double top a few days ago. Look at this daily chart:
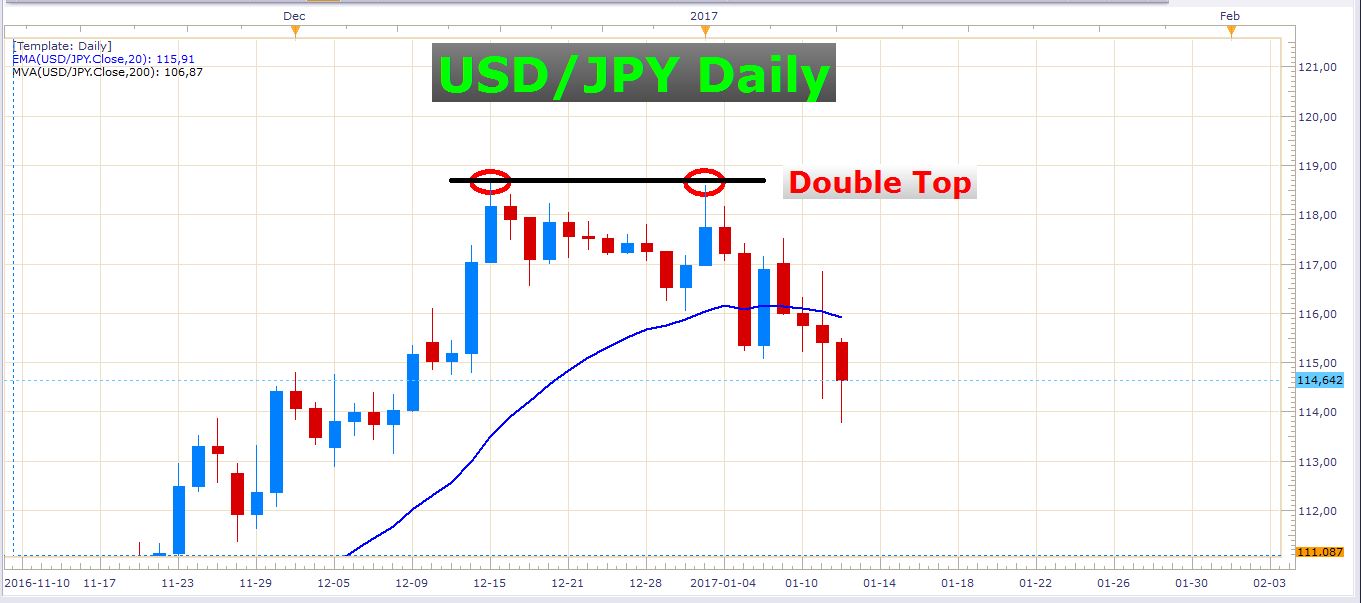 USD/JPY Daily Chart
I’m expecting a continuation of this weakness over the next few days and weeks. Keep your eyes open for short opportunities!
GBP/USD – The Pound is on the Backfoot
The Great British Pound has really performed terribly as of late. Look at this daily chart of the GBP/USD:
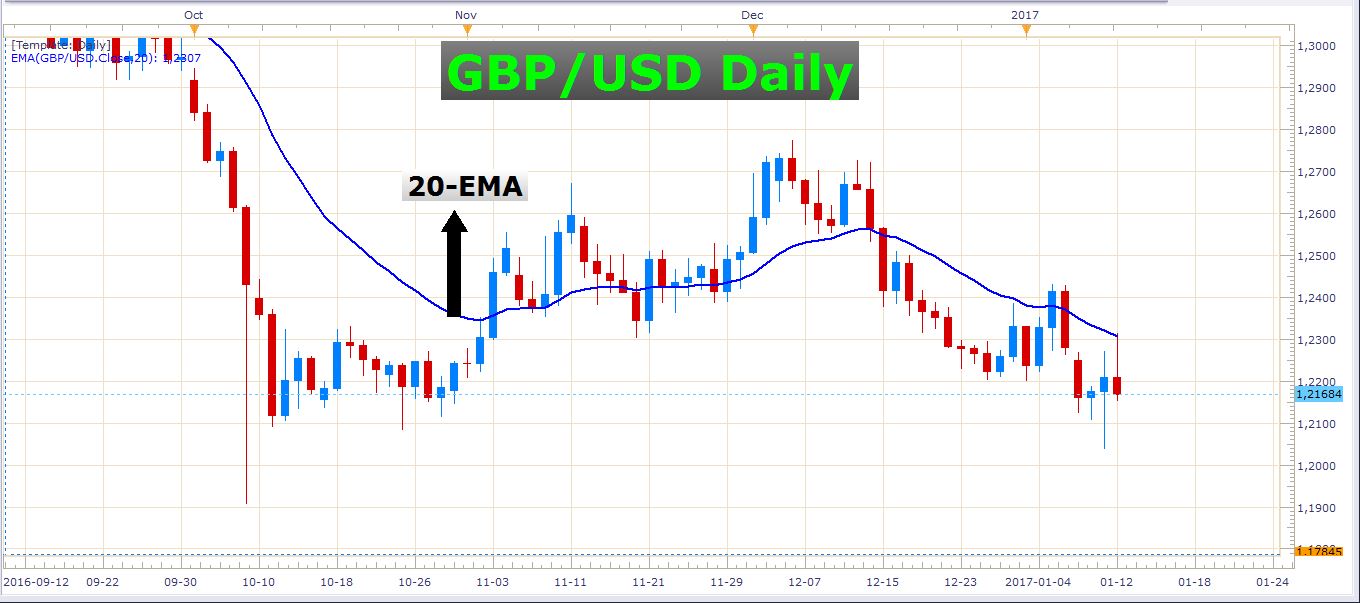 GBP/USD Daily Chart
Today was a poor day for the US Dollar, but the pound was even weaker. One would have thought that the pound would at least have gained slightly against the dollar today, even if it were only a few pips. After all, all the other major currencies strengthened against the dollar today.
I like the short side of the pound against many currencies, of which one of my favorites is the Japanese Yen. Look at this chart:
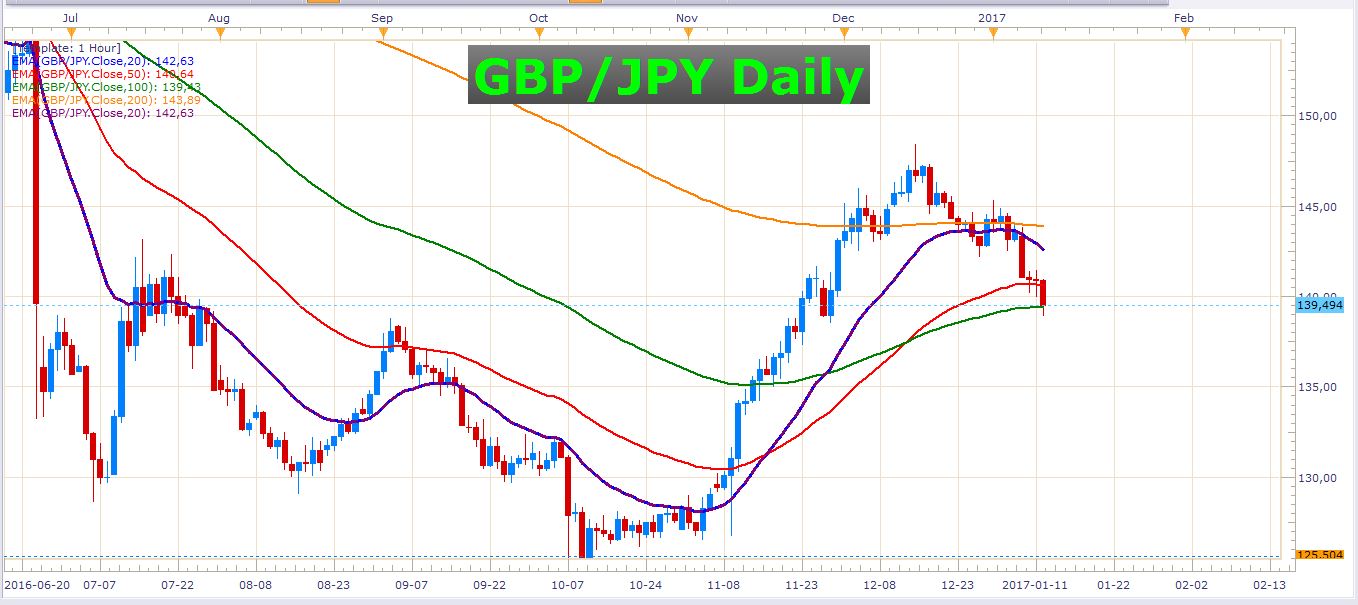 GBP/JPY Daily Chart
That’s all for today, guys, and girls. All the best with your trading!
- Check out our free forex signals
- Follow the top economic events on FX Leaders economic calendar
- Trade better, discover more Forex Trading Strategies
- Open a FREE Trading Account
- Read our latest reviews on: Avatrade, Exness, HFM and XM
Related Articles

Sidebar rates
Related Posts
