US Dollar Still Negative, Swiss Franc and Yen are Gaining Against the Buck. Will NFP Save the Buck next Week?
Hi, traders! On Sundays, I usually can’t wait for the markets to open. I’m like a 7-year old boy with a new bicycle on a very rainy day. I’m unable to try out my new tricks until the rain stops pouring. Frustrating…
At least we know the markets aren’t going anywhere, and this week has the potential to offer some great trading opportunities. Next week we have the much anticipated US Nonfarm Payrolls numbers, and of course, there are many other economic news events as well.
The markets have been a bit choppy lately, and the countertrend moves we saw in many instruments have made trading more challenging than it normally is.
US Dollar Index – The Greenback is Struggling
One of the countertrend moves we’ve encountered is on the US Dollar Index which has sharply corrected lower. As you may know, the US Dollar is the most significant currency in the global market by far. It plays a key role in global trade and is also the dominant reserve currency of the world. When the Dollar’s value rises or falls, the financial world takes note of it, and so should we. Let’s look at a daily chart of the US Dollar index:
 US Dollar Index Daily Chart
It is very important to note that this instrument has not traded above its 20-day exponential moving average in quite a few trading days. This shows us that this retracement should be taken seriously. You will notice that the previous retracements spent little to no time below the 20-EMA, and the 20-EMA acted as support for quite a while before this recent sharp decline took place.
Something that should also be a major concern for the bullish participants, is the strong bearish candle that was printed on Tuesday last week. I have marked it on the following chart:
 US Dollar Index Daily Chart
If you examine this chart closely, you’ll see that this strong bearish candle has the largest body of all the candles on this chart. Size matters when it comes to candlestick analysis. I wouldn’t be surprised if we see some follow through of this bearish momentum in the week to come.
The blue zone which is marked “Important Swing Level” is an important focal point which stands a good chance of being tested in the next week or two. If the bears manage to overcome this level, we could have a larger correction on our hands. This would break the existing sequence of higher swing lows. Remember that higher swing highs and lows are characteristics of a healthy uptrend.
Let’s look at a few currency pairs…
USD/CHF – Heading Lower and Lower
 USD/CHF Daily Chart
This pair has roughly the same formation as the US Dollar Index, and the short-term outlook is very bearish. I wouldn’t be surprised if it reached the 200-day moving average soon, which is the next important target.
It would be a good idea to wait for a punch through this soft support zone, and then to enter short on a retracement to the 20-EMA, for example. Look for a favorable candlestick formation to confirm your short entry, like a pinbar rejecting off the 20-EMA on the daily chart or even on a 4-hour chart.
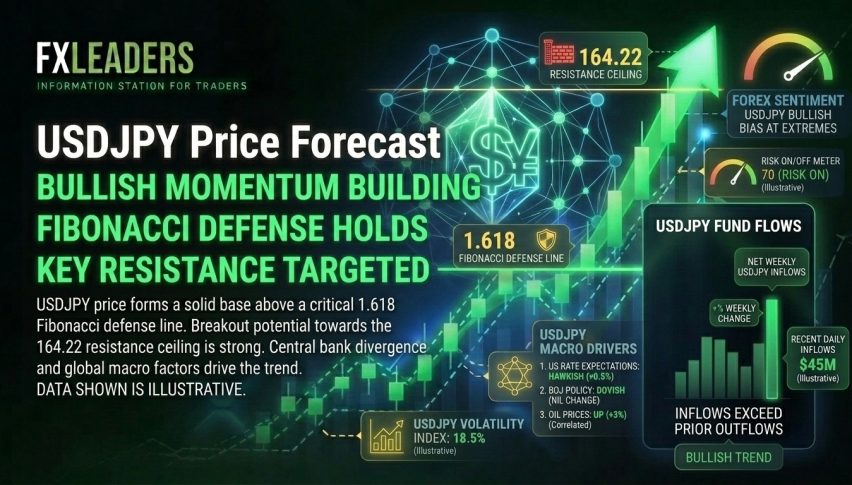
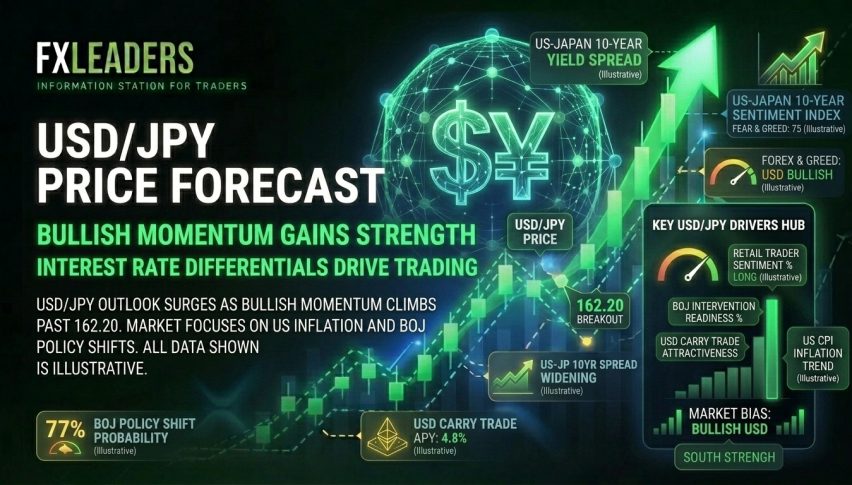
USD/JPY – At a Good Level to Sell
 USD/JPY Daily Chart
I have already entered short on this pair. Thursday’s rejection candle has a smaller range than which is ideal, but it has rejected off the 20-EMA which makes it a good sell signal. Friday’s candle closed lower than its open, which makes this setup even more attractive.
The current price could be a good entry level. Stop placement should be a few pips above Thursday’s high. Look at the following chart:
 USD/JPY Daily Chart
The other option would be to sell at a 50% retracement of Thursday’s candle, which is roughly at the current level of the 20-EMA.
Now that’s enough FX for today, let’s look at some other instruments:
Dax – The Bulls are not Backing Off
 Dax Daily Chart
I’m currently in a long position on the Dax and waiting for the price to trade higher. All looks fine for the bulls, and there is no technical reason to doubt this uptrend at the moment.
The bears recently pushed down this pair to the 20-EMA but they were unable to sustain their selling momentum. The price quickly shot up again which formed a splendid pinbar rejection off this moving average.
With consolidations like this, the price usually breaks out higher if the preceding direction was up. Let’s see if we manage to get this break in the week ahead.
WTI Crude Oil – Still Supported
 WTI Crude Oil Daily Chart
The bulls have been fighting hard to keep the price of West Texas Intermediate Crude Oil above its 20-day exponential moving average. This market is a bit choppy at the moment, but Friday’s large bullish candle suggests that we could see fresh yearly highs soon. A firm close above $54 could signal that the bulls are ready to advance to these new highs.
News
Tomorrow is a rather quiet day concerning economic news. We only have US Pending Home Sales at 15:00 GMT.
Stay tuned for more market analysis, and good luck with your trading this week!
- Check out our free forex signals
- Follow the top economic events on FX Leaders economic calendar
- Trade better, discover more Forex Trading Strategies
- Open a FREE Trading Account
- Read our latest reviews on: Avatrade, Exness, HFM and XM
Related Articles

Sidebar rates
Related Posts
