The Dollar is Slipping Further, USD/JPY is Tumbling
It’s always a pleasure to see an instrument gap lower on a Monday if you’re holding short exposure on it over the weekend. As I mentioned in my previous article, I had a short position running on the USD/JPY which I opened on Friday evening.
I also recommended selling the pair at about 114.570. Unfortunately, there wasn’t an opportunity for our readers to enter at this price today, as the price gapped past this level, with the next best price coming in at 114.248. If you were up early enough to enter at this price, you would have been in profit by about 116 pips by now. If we had a chance to enter at the recommended price of 114.248, it would have been 144 pips. Let’s take a look at some charts:
USD/JPY – Profits are Rolling in for the Bears
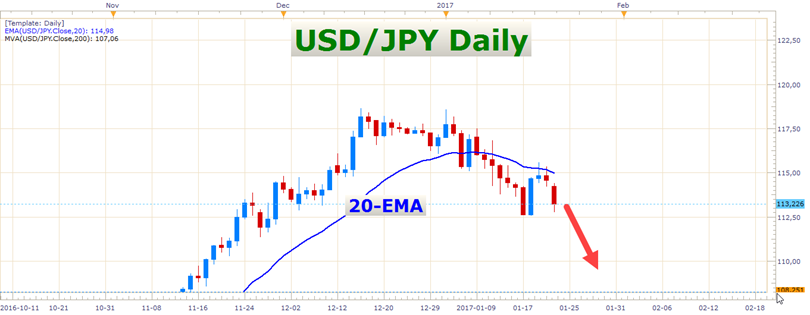 USD/JPY Daily Chart
I just couldn’t withstand this rejection off of the 20-EMA. As you can see, it offered the perfect opportunity for a short play on this pair.
Today’s decline was pretty aggressive, which advocates a continuation of this bearish momentum in the days ahead. A breach and close below this recent swing low would make the bears even more confident, and I expect this to happen pretty soon.
Conservative traders might want to wait for the price to trade through this most recent swing low first, and then to retrace back to this same level before looking for selling opportunities. Aggressive traders can use smaller timeframes like a 4-hour chart to sell retracements to the 20-EMA, for example. Of course, there are many other ways to trade the USD/JPY in this situation. Whatever you do, don’t forget to use the candlestick formation for confirmation at key levels, for example, a specific resistance zone, or dynamic resistance like a moving average. It helps a lot to see how the price reacts to your chosen resistance level, to see if there are any signs of rejection off of it.
Nikkei – Looking Very Heavy
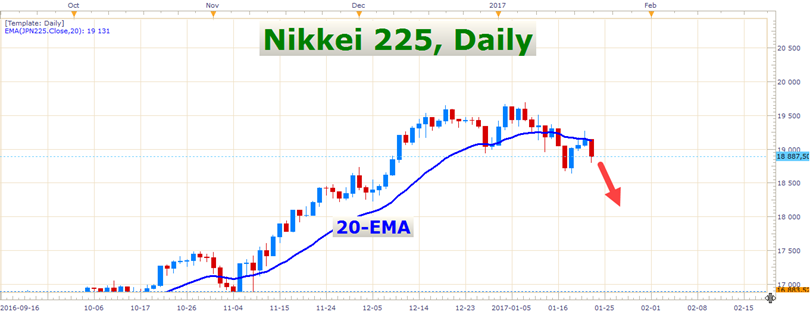 Nikkei 225 Daily Chart
This Japanese stock index is highly correlated to the USD/JPY. Here you can see that it also rejected off of the 20-EMA on Friday. The fact that it’s struggling to get above this moving average strongly suggests that we could get another leg lower in the near term.
GBP/USD – This is Really Interesting
The GBP/USD has been very bullish since the UK Prime Minister Theresa May’s speech last week. When I look at today and last week’s price action, I see something really interesting – a whole bunch of bullish daily shaved bars. This pair has printed no less than four of these in the last five trading days. Just to clarify what a bullish shaved bar is: it is a candle that closes on, or very close to its high. I’ll mark them in the following chart:
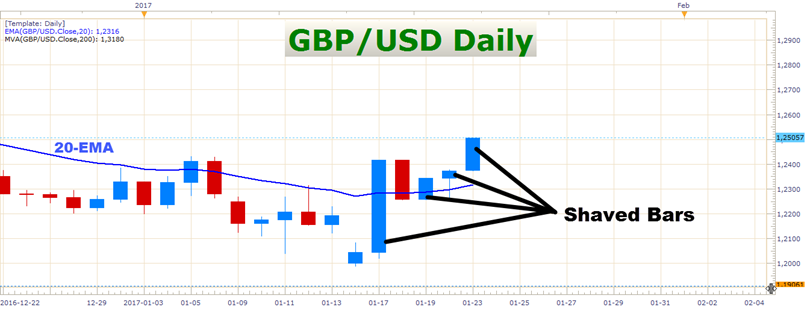 GBP/USD Daily Chart
A bullish shaved bar is a clear demonstration of buying strength in a market, especially if it’s a candle with a very large range. You see, the fact that these candles closed on their highs or very close to it, tells us that the bulls retained control of the market until the very end of each of these trading days. A shaved bar’s momentum is often carried over to the days which follow it. To see so many shaved bars in such a short time creates an expectancy of more upside to follow in the days ahead.
My recommendation is not to just jump into this market and start buying every Pound you can lay your hands on, though. Let us not forget that this pair is technically still in a downtrend and that the fundamentals of the UK economy and the Pound don’t look too great at the moment. Perhaps this recent bounce is just a mere relief rally which will quickly fade away as soon as the Brexit fears start to settle on the market participants again. I say this just to caution you to be careful here.
Besides this, the recent bounce has already moved more than 500 pips. This move is becoming a bit extended, which makes a bullish play slightly less attractive on this pair. Nevertheless, the current bullish momentum is really aggressive, and there might be some handsome profits to be made by playing the long side here. This setup may be more attractive to experienced traders.
Quick Market Notes
-
US Existing Home Sales, Tuesday 15:00 GMT.
-
EUR/USD Outlook remains Bullish.
-
USD/CHF still Bearish.
-
USD/CAD has turned lower again.
-
S&P 500 still supported.
-
German Manufacturing PMI, Tuesday 08:30 GMT.
That’s all for today fellow traders, have a profitable day!
- Check out our free forex signals
- Follow the top economic events on FX Leaders economic calendar
- Trade better, discover more Forex Trading Strategies
- Open a FREE Trading Account
- Read our latest reviews on: Avatrade, Exness, HFM and XM
Related Articles


Sidebar rates
Related Posts
