Gold Declines as Expected While Stocks are Soaring
Hello, traders! The markets are moving, and that always causes much excitement. There have been some decent moves in equities, forex, and also in gold. Let’s jump to the charts right away…
Gold – The Bears are Fighting Back!
 Gold Weekly Chart
I’ve had an eye on the gold price for quite a while, and I was expecting the bulls to run out of steam at this former support zone. You see, when the price breaks through an important area of support, this same level often turns into an area of resistance. If you look at the chart above, this is exactly what happened – the price traded right up to this level, struck resistance, and started to sell off from there. Let’s look at a daily chart as well:
 Gold Daily Chart
Here you can see that the price has recently carved out a series of lower highs and lower lows (marked LH and LL on this chart). A healthy downtrend is characterized by lower swing highs and lower swing lows. Another important indicator we can use to determine the longer term trend direction is the 200-day moving average. This is a common filter used by many investors and traders.
I like the way Mr. Ron Rabinov, one of our analysts, explained this decline in the gold price, earlier today: “ The downtrend in the metal is caused by a boosted demand in the U.S. equities and better corporate earnings.” So if you were wondering why the gold price is declining, this may answer your question. You see, when investors’ appetite for riskier assets suddenly increase, they move money out of low-yielding assets, like gold, and buy riskier, higher yielding assets which include equities (stocks). The major global equity indices have risen aggressively this week, and gold has sold off at the same time.
The technical outlook for gold remains bearish for now. This commodity closed below its 20-day exponential moving average today which is a good encouragement for the bears. Traders interested in playing the short side can get in on retracements. I made a good profit yesterday and today by trading breakouts on an hourly chart, so traders who like trading breakouts might also take advantage of this market in the next few days. Trading retracements offers tighter stop placement and larger target potential than trading breakouts but lacks the strong confirmation of trend continuation of breakout trading. Let’s look at some other instruments.
USD/CAD – The Loonie is crushing the Buck
 USD/CAD Daily Chart
The first thing I noticed about this chart, is that we had a firm close below the 200-day moving average yesterday (Wednesday). The Canadian Dollar has been incredibly strong lately. The rise in the oil price has also been good for the Canadian Dollar. As you might know, there is a strong correlation between the oil price and the Canadian Dollar because the Canadian economy is largely driven by oil production and export. There are other production factors which intensify this correlation compared to other oil producing countries and their currencies. If you would like to read more about this, here is a link to an article by our leading analyst Skerdian Meta, which explains it in more detail: Where is the Canadian Dollar Headed?
The USD/CAD is at an important support level. If the price breaks through this level, we could face a large decline from there. This pair has been a bit choppy lately, so be careful if you’re going to trade it. I would prefer to see the pair break lower first, followed by a retracement before I go short. This is just to confirm the break lower.
WTI Crude Oil
Crude oil posted a pretty strong close today. It looks like we could see higher prices in the days and weeks to come. Look at the following chart:
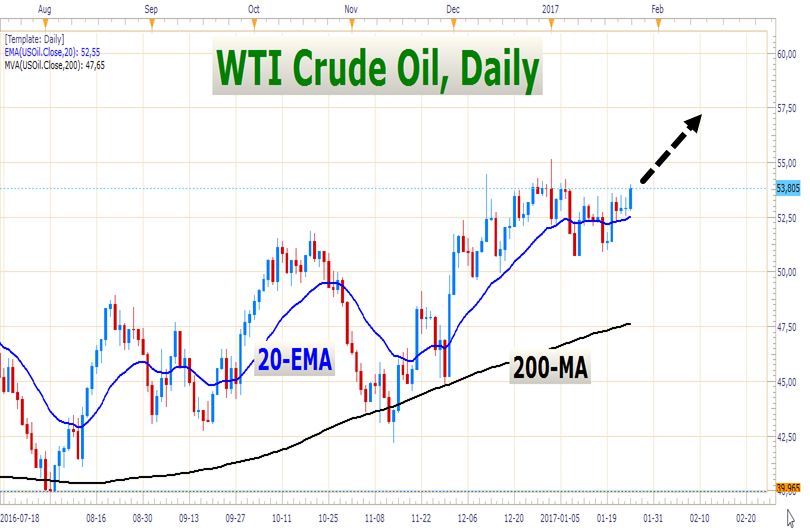 WTI Crude Oil Daily Chart
Perhaps it won’t happen immediately, but the chances of a break higher look better and better. If we look at our technical indicators, the 20-EMA and 200-MA, we have to side with the bulls for now. The price is firmly above both of these moving averages, which tells us that the momentum and the trend are both bullish.
That’s all for today friends, good luck with your trading, and stay tuned for more market analysis!
- Check out our free forex signals
- Follow the top economic events on FX Leaders economic calendar
- Trade better, discover more Forex Trading Strategies
- Open a FREE Trading Account
- Read our latest reviews on: Avatrade, Exness, HFM and XM
Related Articles


Sidebar rates
Related Posts
