British Pound Going Haywire!
Hi, guys! What a day in the markets! We saw a very large move in the GBP/USD in the last few hours which is a direct result of the Scottish parliament’s vote against triggering Article 50, which would trigger the Brexit process. You see, the Pound lost a lot of value because of Brexit fears, and of course when the Brexit vote was confirmed a few months ago. This suggests that the Pound would gain an impressive amount of value if the whole Brexit thing never worked out in the end. Perhaps this vote by the Scottish parliament is just the start of great things for the Great British Pound. Let’s look at a few charts…
GBP/USD – The Bulls are Engulfing
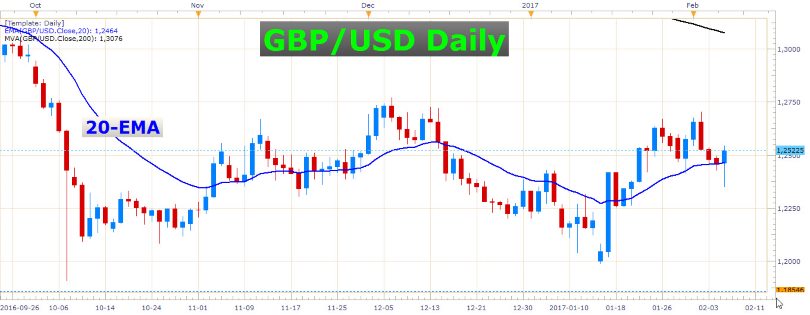
 GBP/USD Daily Chart
As you may have noticed, the GBP/USD printed a bullish engulfing candle today. This means the low and the close of the candle is ‘outside’ of the whole range of the preceding candle. This is a vivid demonstration of strong buying power, especially if the engulfing candle has a large range. It often leads to a continuation of the bullish pressure and can be a great way to shake a few bucks out of the FX market. I wouldn’t be amazed if we see some follow-through buying on this pair in the days to come. Keep an ear open for further developments on the Brexit theme, as this could be an important driver of this pair in the near-term.
USD/CAD – I Take Back Every Word of Doubt
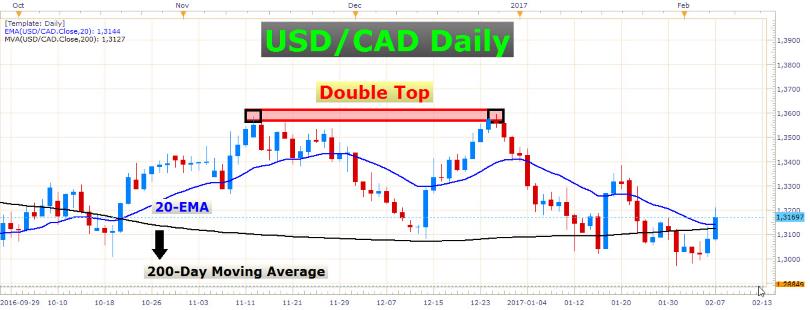
 USD/CAD Daily Chart
I didn’t think the USD/CAD would close above its 200-day moving average soon. Nevertheless, it did. And it didn’t take very long either.
If you've read my previous article, Impressive Day For The USD/CAD, But Will It Find Traction Above Its 200-Day Moving Average?, you might remember that I said I expected the oil price to decline in the next few days. This is exactly what happened today, only much more than I expected. The combination of a stronger US Dollar today and the decline in the oil price both worked in favor of the USD/CAD.
Although I recognize the buying strength behind this rise in the USD/CAD, I wouldn’t engage in long positions just yet. If you look at the chart above, you’ll notice that the 20-EMA has been sloping downwards for quite a while, and the current price is at a point which can be considered to be a lower high – at least for now. Buying at a lower high is not the best thing to do. We want to buy at higher lows instead, in a market which is decisively bullish and in the process of forming higher highs and higher lows. So although we need to take note of today’s bounce in the USD/CAD, we need to be careful before turning bullish. We need more evidence of an uptrend than a mere close above the 200-day moving average. Let’s look at a weekly chart for a bit more perspective:
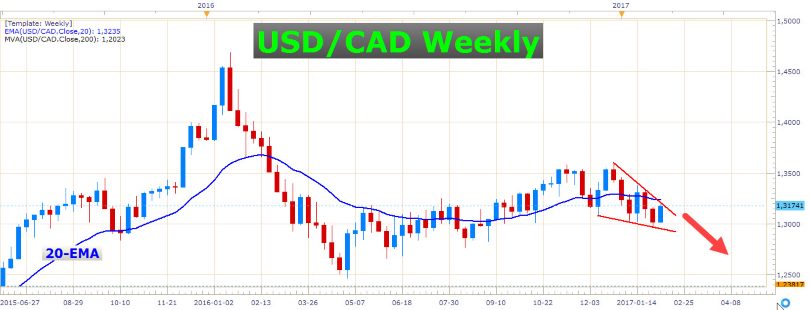
 USD/CAD Weekly Chart
The first thing I noticed on this weekly chart, is that the price is currently below the 20-EMA. We can also see that the price has clearly moved lower in the last seven weeks. The 20-EMA could be a tough barrier for the bulls to overcome in the near-term.
S&P 500 – Still Holding Steady

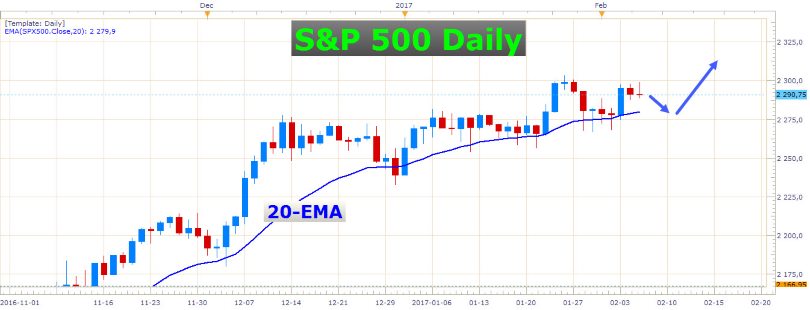
S&P 500 Daily Chart
Although the S&P 500 had a disappointing day today, the overall picture remains very bullish. This American stock index is engaged in a well-defined uptrend. We know this because it has been printing higher highs as well as higher lows. The bullish momentum is still intact, and the price is holding steady above the 20-day exponential moving average. I will be on the lookout for buying opportunities on this instrument in the days to come.
That’s all for now, guys. Keep well, and good luck in the markets!
- Check out our free forex signals
- Follow the top economic events on FX Leaders economic calendar
- Trade better, discover more Forex Trading Strategies
- Open a FREE Trading Account


