ECB, RBA, and NFP to Provide Some Action in the Markets.
I always like it when the week ahead contains some important news events. It’s always the easiest to make money when the markets move much, and events like interest rate decisions, US labor market data, and an ECB rate decision could be just what we need for some explosive price action this week.
The first important event on the docket is an interest rate decision by the RBA (Reserve Bank of Australia) together with their rate statement. This will be on Tuesday at 03:30 GMT. Of course, this is not the only important news out of Australia this week. On Monday we have retail sales numbers at 00:30 GMT. The interest rate decision obviously carries more market moving potential than the retails sales number, except in the event of a very extreme retails sales number reading. Let’s take a look at the AUD/USD technicals:
AUD/USD – Short Idea Playing Out Beautifully
I mentioned in the February 28 trading plan (The Aussie is Coming Down! Weekly Timeframe is Haunting the AUD/USD), that the AUD/USD could face some selling pressure in the weeks ahead. This pair has indeed traded lower in the meanwhile, and its technical outlook still remains bearish. However, we should be careful of the above-mentioned events, as they certainly have the potential to surprise the bears on Monday and Tuesday. Here is a weekly chart of the AUD/USD:
 AUD/USD Weekly Chart
What actually made me short this pair, are the bearish rejection candles which recently pierced this red resistance zone in the chart above. A weekly chart really contains a lot of data, which makes analysis done on it really accurate. The weekly and daily timeframes are really important to professional and institutional traders because of their reliability. Smaller timeframes are handy when it comes to fine-tuning trade entries.
Let’s look at a daily chart of the AUD/USD:
 AUD/USD Daily Chart
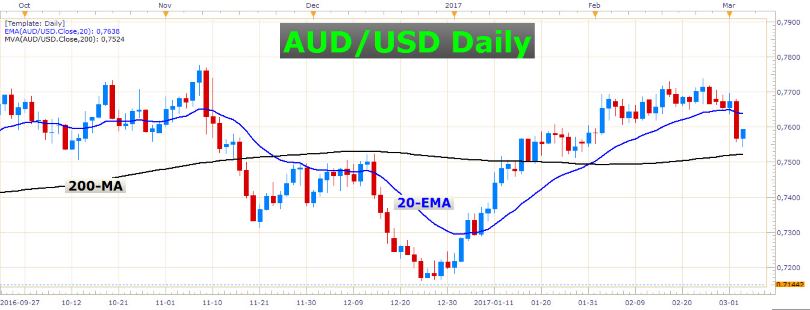
On this chart, it is obvious that there has been a structural change in the last couple of trading days. Firstly, the strong bearish candle which closed below the 20-day exponential moving average indicates to us that the market has finally decided it wants to head lower. Before this decisive break lower, this pair had been trading largely sideways for quite a few days.
If you closely examine the chart above, you will see that this last bearish candle has an above average range. In fact, it has the largest range of the last 55 candles. When we see such a large daily bar, it is certainly something to take note of, especially if the candle closes close to its low in the event of a bearish candle, as was the case with this particular candle. I wouldn’t be surprised if we saw strong follow-through of this bearish momentum in the days ahead. Of course, the economic data out of Australia this week could play an important role in the exchange rate, not to forget about the US Nonfarm payrolls on Friday which is known to be a major market mover.
GBP/USD – Still Range-Bound
 GBP/USD Daily Chart
The GBP/USD is still trading in a large range. The price has been trading below the 20-EMA for a couple of days already, and it seems like we could possibly see a retest of the range bottom in the next few weeks.
The British economy is still overshadowed by the dark Brexit cloud of uncertainty. It is difficult to say how the Pound will fare in the next twelve to eighteen months. At the moment it might be better to be reactive to price action signals rather than trying to predict where the exchange rate will be a few months from now. Let’s see if we get a retracement to the 20-EMA in the days to come. Perhaps we’ll find a useful sell signal in that region to take advantage of.
EUR/USD – Structural Change?
 EUR/USD Daily Chart
Friday’s daily candle on the EUR/USD is a clear warning to the bears to be careful. First of all, this candle is really aggressive with a range of over 100 pips and a close near its high. Secondly, it closed above the 20-day exponential moving average, which is certainly not something you’d want to see when you’re in a short position.
It looks like the EUR/USD could stay confined in a range for a good while to come. I would have liked to see the pair trade down to its yearly low, but it looks like the bears have run out of steam for now.
If you’re trading the EUR/USD or any other Euro pair this week, be careful of the ECB interest rate decision and press conference on Thursday. These events can cause great FX volatility, especially in Euro pairs.
By the way, if you’d like to sharpen your trading skills, make sure you check out all our different forex trading strategies!
Nikkei 225 – Also Range-Bound
 Nikkei 225 Daily Chart
The Nikkei bounced last week but was unable to clear the range top which also contains the yearly high. Perhaps we will encounter some further sideways price action in the weeks ahead. Just remember, that this Japanese stock index is in an uptrend when we look at the bigger picture, and trading far above its 200-day moving average. The probability lies to the topside, so if you’d like to play the range here, it would be better to buy at the range support, than to sell at the range top. This index will probably break out higher eventually.
If you haven’t traded the Nikkei yet, this is one of the brand new instruments on which we offer trading signals.
S&P 500 – The Stud Bull
 S&P 500 Daily Chart
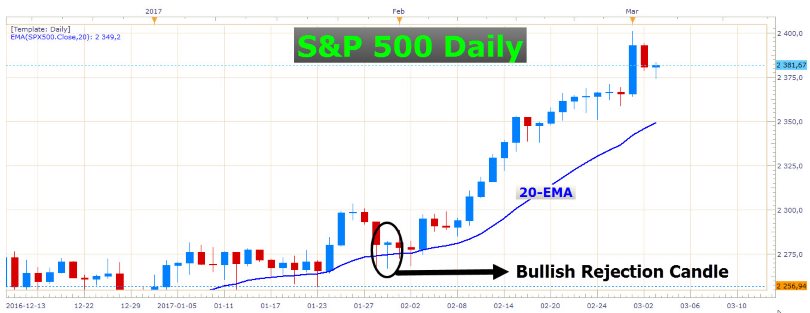
This massive bull trend is really impressive! I can only recommend buying dips on this stock index. The price might move closer to the 20-EMA in the next few days if we get some kind of consolidation. Watch out for bullish rejection candles for a trigger to get long. These will help you to get into high-probability trades. Here is an example of a bullish rejection candle I traded a few weeks ago. I also wrote about it in this article: US Dollar Trades on the Back Foot While Equities are Correcting Lower.
 S&P 500 Daily Chart
As you can see, this particular candle was a really great trigger into a long trade which produced a considerable profit. Perhaps we’ll get another golden opportunity in the next few weeks to catch another one of these beauties.
That’s all for now, guys. Remember to be careful around all of these event risks, and don’t forget about the US NFP report on Friday. Have a profitable week!
- Check out our free forex signals
- Follow the top economic events on FX Leaders economic calendar
- Trade better, discover more Forex Trading Strategies
- Open a FREE Trading Account


