How to Trade Right Through Political Instability, and Other Triggers of Volatility Profitably
Do you think it’s possible for financial markets to react in a perfectly calculated and scientific manner when they get bombarded with events like wars, presidential elections, political and economic re-arrangements (e.g. the Brexit), adjustments to monetary policy, recessions, depressions, and other important catalysts? Of course not.
First of all, it is way too complicated to calculate a specific financial instrument’s exact fair value after an important event starts to alter its current value. Secondly, human beings are emotional and many times behave irrationally. People make calculation mistakes, bear the burdens of sickness, stress, and tiredness, are greatly influenced by fear, and greed, yet we continue. Markets are imperfect and will always be imperfect.
Although markets, like the spot currency market, could never reflect politics and economics precisely, the market often moves in the direction which matches the particular event. For example, we often see that a country’s currency strengthens when it raises its interest rate. This is a typical ‘textbook’ market reaction.
Another example is when the British voted to leave the European Union in June 2016. Everyone knew that the pound would weaken significantly if the Britons voted to leave. This is exactly what happened – Sterling lost about 13% against the U.S. dollar in 9 days. Look at this daily chart of the GBP/USD:

GBP/USD Daily Chart
That translates into a loss of about 1900 pips. Of course, the pound continued to lose value since then and is currently trading at 1.24723 which is more than 15% lower than the day before the Brexit vote.
There are many other examples of instances where the particular catalysts affected the FX market and other markets in a way which makes perfect sense. We can definitely reason that there are often events which can be traded successfully by using a fundamental approach, so to speak. The problem is, that the market many times doesn’t react to events in the way we expect it to. Or sometimes it moves in the anticipated direction, but not nearly as aggressively as anticipated. Trading from of a purely fundamental analysis standpoint is risky.
Another problem with a purely fundamental approach is the extremely important factor of market pre-positioning, or the ‘pricing in’ of a specific event (or events) long before it actually happens. You see, many institutional market players are experts at this. They carefully monitor the political and economic situation of certain countries, meticulously analyzing economic indicators to pick up changes in inflation, gross domestic product (GDP), international and local trade numbers, and other events to forecast future economic growth.
They also consider fiscal policy and the rhetoric of central bankers to lead them in their estimations and calculations. Then, after much analysis, they put this knowledge into action by buying or selling certain instruments in anticipation of what will most probably happen in the future. The effect is that when a certain important event takes place, the outcome has often been ‘priced in’ already by most of the big boys, or the institutional players, which are the ones who really move the markets. Examples are governments, central banks, and hedge funds.
This is where retail traders often lose money. They anticipate a certain event like an interest rate decision with the idea that the particular country’s currency will surely strengthen if the central bank raises the interest rate. After all, this is something that we often see and also what the textbooks suggest, isn’t it?
Let’s take this month’s FED interest rate decision as an example (15 March 2017). Everyone knew that the probability of a rate hike was nearly 100%. I wonder how many traders engaged in long dollar positions in the days and hours preceding the event, expecting a mighty bull run.
As expected, the FED hiked. However, the U.S. dollar weakened significantly when the decision was revealed. How could this be? Isn’t a currency supposed to rally when there is a rate hike? This caught many traders on the wrong side of an impulsive dollar decline. Look at this hourly chart of the USD/JPY:

USD/JPY Hourly Chart
As you can see, the U.S. dollar got blown away by the good news of a rate hike (not what you would typically expect).
The traders who had positioned themselves for U.S. dollar strength failed to recognize that this rate hike had been ‘priced in’ long before it actually occurred. Technically, the dollar had reached levels at which at was quite overvalued. When the new interest rate was released, the clever traders took advantage of this and sold the dollar aggressively.
Reacting Versus Predicting
A vital ingredient of successful trading is observation! This is much more practical and viable than trying to predict market movements. Yes, we need to look forward and examine the possibility of certain outcomes, but we need to do so in a realistic and proactive manner. This is where technical analysis is of utmost importance.
Let’s take this FED interest rate decision as an example. The traders and investors who fell in love with a rising dollar, and stubbornly held onto their bullish bias, got their fingers burnt in the process.
The well-informed traders, on the other hand, handled the event in a prudent manner. They knew they had to be careful here, and they probably observed and analyzed the price action first before engaging in the market. Had they been in U.S. dollar positions leading into the release, they would have taken measures to mitigate or eliminate their risk. Let’s look at an hourly chart again, and see how this event could have been traded by reacting to the price action which resulted from the release, rather than trying to predict the market’s reaction before the time. Let’s zoom out a bit…

USD/JPY Hourly Chart
Let’s say we wanted to approach this event really carefully and just trade the price action which followed, using technical analysis techniques. In this example, we would only have entered in short about two days after the release by using a slow stochastic crossover signal. This would have eliminated all the immediate risk which this rate decision (and FOMC press conference) presented. You see, the FX market is often extremely volatile during events like these, and directly after it. Many times the market makes erratic, choppy moves which can easily shake you out of your trades. When such data is released, liquidity is usually really thin which creates a dangerous environment to trade in. At the moment of such a release, and immediately after it, the spread normally widens considerably which is very undesirable.
By first waiting for an instrument to reveal its true directional intention, we can engage in really good trades which are backed by solid confirmation. As you can see in the chart above, the slow stochastic indicator pointed out some really good selling opportunities which were easy to utilize without the stress and pressure of having to make the quick decisions of news trading.
This approach would also have given you enough time to analyze the situation on different timeframes, of which the daily timeframe is really important. Let’s look at what happened on the daily chart:

USD/JPY Daily Chart
Here you can see that the candle printed on the day of the rate decision has an impressive range, and also closed close to its low. Another factor which needs to be considered here is the location of this powerful bearish candle. It opened far above the 20-day exponential moving average and closed well below it. Did we need any more confirmation than this strong bearish candle? You’ll notice that the pair continued to decline for six consecutive days after this big, decisive day.
Let’s look at another example of where ‘reacting’ was a much safer and more effective approach than ‘predicting’. This time we’ll examine a political catalyst that caused tremendous volatility, not only in the forex market but also in other markets like the equity and commodity markets. Curious yet?

USD/JPY Daily Chart
Some of you will recognize this prominent candle. Yes, you guessed it – the effect caused by the U.S. presidential election last year.
If you examine this daily candle with its impressive range of about 465 pips, you’ll notice that it has a very long downward wick (shadow). This tells us that there was immense volatility on that day. The candle opened and traded about 395 pips lower. It then made a sharp reversal and rose 465 pips to its high, after which it gave back about 21 pips to print a pretty strong close to end off the day. This is what it looks like on an hourly chart:

USD/JPY Hourly Chart
Impressive price action, isn’t it?
Let’s get back to ways of how to handle immense volatility like this. Remember, we’re considering ways to mitigate our risk and increase our chances of success by reacting to the price action we encounter, not to what we hear over the news, or what everyone is expecting to happen, etc.
You don’t want to pre-position yourself into events like this presidential election. You might reason that you could have made a boat full of money if you bought the USD/JPY on the day of the election, just before the results were finalized. That’s right, you might have made a killing, but you would probably have not. Are you aware that you would have been stopped out of your position if you had used a stop loss smaller than 312 pips? That’s if you were lucky enough to buy at the low of the day. If you had bought at the high of the day, your stop loss would have to have been at least 392 pips from your entry. So we can come to the conclusion that very few traders who pre-positioned themselves in long trades just prior to the election actually survived the massive selloff which followed early on 19.11.2017. You see, it is abnormal to use a stop loss of between 300 and 400 pips on the USD/JPY. Traders usually don’t use stop losses wider than 100-200 pips on this pair.
Here’s how you could have nailed this setup. Let’s get back to the daily chart:
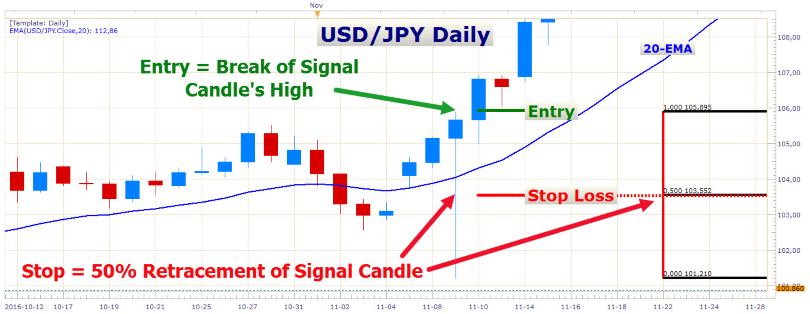
USD/JPY Daily Chart
If you avoided this extremely volatile trading day (which you should have) and entered long on the following day when this volatile day’s high got breached, you would have gotten yourself into a magnificent trade!
A good level for the stop loss would have been at the 50% retracement of the signal candle’s range. When we encounter a candle with such a long wick(393 pips!), we don’t want to place a stop loss below the low of the wick. This would make the stop loss incredibly wide, which is the last thing you’d want to do. If you had done that, your stop loss would be a terrible 469 pips. Placing a stop loss at the 50% retracement halves the stop loss distance and allows you to use double the position size and still risk the same percentage of your account's equity. With double the lot size, your profit would have escalated twice as fast compared to the larger stop loss option. You would also have been able to achieve a much better risk-to-reward ratio with the tighter stop loss.
You’ll notice that in this example the stop loss is placed below the 20-day exponential moving average. This moving average often provides excellent dynamic support in a strong uptrend, therefore it helps to have it between the market price and your stop loss.
When you trade smaller rejection candles than the one in this example, you would normally place a stop loss below the low of the wick. This is the more conservative way.
So what about a target? Well, with such a splendid bullish rejection candle as this one, you could easily aim for three to four times the distance of your stop loss. In this case, the pair made a marvelous run of 1270 pips before correcting lower. That is 5.4 times the distance of your stop loss. A conservative target would have been 2-3 times the distance of your stop loss. Remember that there are many different ways to manage your targets and trail your stop losses. We will discuss this on another day, though.

USD/JPY Daily Chart
In this chart, the target is set at 705 pips, which is 3 times the distance of the stop loss.
Be Prepared for More Volatility
At the moment, the dark Brexit cloud is overshadowing the UK economy. Theresa May intends to trigger Article 50 on Wednesday, 29 March. This will start the UK’s two-year exit process.
Much of the Brexit has already been ‘priced in’ by market players. Nevertheless, the path forward will probably be a bumpy one with much tradable market action. On the one hand, the Brexit theme is weighing on the pound, and on the other hand, the prospects of higher inflation in the UK is supporting it (the Bank of England would have to counter this rise in inflation by raising interest rates, which in itself is supportive of the pound).
In the meanwhile, the new U.S. president, Donald Trump, has the potential to rock the markets at any time. His aggressive approach in leading the U.S. is keeping market players on their toes.
Let us not forget about the Eurozone’s problems. The Single Market is in the process of losing one of its most important members (the UK). If some of its other members took the same route, it would weigh on the region’s economic efficiency and underlying cooperative strength.
In Conclusion
Whether we encounter high-level political events, important policy decisions by central banks, or serious economic data, we can make the best of every situation by observing the price action which results from these catalysts. With events which carry a risk of extreme volatility, it helps to stand aside until the initial volatility subsides before making your trading decisions.
Many of the major market players who have the capacity to actually move the markets, normally take enough time to properly analyze a particular situation before they act upon it. Don’t be in a hurry to jump into a trade. Wait for the right opportunity to present itself.
Lastly, don’t take anything for granted when it comes to what the market reaction should be, or what it normally is when ‘this’ or ‘that’ happens. The price action will show you what’s really going on.
Happy trading!
- Check out our free forex signals
- Follow the top economic events on FX Leaders economic calendar
- Trade better, discover more Forex Trading Strategies
- Open a FREE Trading Account
- Read our latest reviews on: Avatrade, Exness, HFM and XM
Related Articles
Sidebar rates
Related Posts
