Crude Oil Catches Fire – Unstoppable
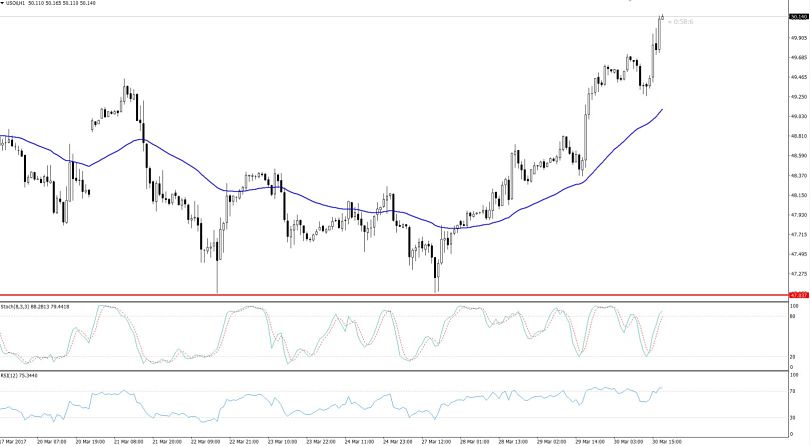
The U.S trading session began with a massive bullish wave in crude oil. When writing this update, the crude oil was trading aggressively higher at $50.34, breaking above the psychological trading level of $50 for the first time in three weeks.
One of the reasons behind this bullish movement is the remarkable gains in the GDP (gross domestic product) figures released by the United States. The GDP growth for the 4th quarter of 2016 was revised to 2.1%, which is significantly higher than the previous figure of 1.9%. This figure also exceeded the expected 2% GDP growth.
What's the link between U.S GDP growth and Crude Oil?
The one line answer is, the United States is the biggest oil consumer in the world. As per the statistics shared by EIA (Energy Information Administration), the United States consumed approximately 19.4 million barrels of oil per day (mbd) in 2015. Yes, that's a huge number!
This is why upon the release of positive manufacturing, retail sales, inflation, factory orders or GDP figures, the crude oil catches fire.
Looking at our Oil Trading Signal, which was doing really well and remained in profit for so long before the release of the news, it has now been hit by a stop-loss at $50.15. It appears the signal is teaching us a lesson in money management.
Traders, we simply need to drag our stops to breakeven after the trade yeilds a profit. This will keep us secure from sudden changes in fundamentals.
 Crude Oil – Hourly Chart
For now, the crude oil is likely to find resistance at $50.45 and $51.20 along with a support at $49.75. Nevertheless, the crude oil has entered into the overbought range and we may see a slight pullback in its prices.
- Check out our free forex signals
- Follow the top economic events on FX Leaders economic calendar
- Trade better, discover more Forex Trading Strategies
- Open a FREE Trading Account
 Crude Oil – Hourly Chart

